Stands and boundaries
Define the project area, lay out a cruise grid, and stratify stands. This chapter covers the project boundary, plot layout, and drawing and importing stand boundaries. All of this can be done in a web browser, where a big screen and a mouse make it easier than on the phone.
3.1Boundaries and stands
A project has two kinds of outline:
- The project boundary is the edge of the property you are cruising, usually the tax parcel. It sets the area for the grid layout and is the frame that stands are drawn inside. A project has one, which can be made of several separate pieces.
- Stand boundaries divide that ground into management units. Each stand has its own acreage, its own plots, and if you like its own sampling method. Reports summarize each stand and roll the stands up into the whole property.
Every plot belongs to one stand. When a plot has a GPS location, the app places it in the stand whose boundary contains it, and moves it if you move the plot or redraw the boundary (section 3.10).
Boundaries, maps and the grid layout are part of Pro. In Basic, stands are a plain list: you type each stand’s acreage and move plots between stands by hand. Parcel boundaries, Densify and NRCS soils are Max features.
Do the map work on a computer
Drawing a boundary means placing dozens of corners exactly, and a fingertip covers a lot of ground on a phone screen. We recommend setting up boundaries, stands and the plot layout at a desk, then taking the phone to the woods.
- On your computer, go to app.forestmetrix.com and sign in with your usual login, or click Field App on the account page (Chapter 1).
- Open the project. Every screen in this chapter is there, in the same place as on the phone, over Google satellite imagery.
- Make your changes. They save to the cloud as you go.
- Before you head out, open the project on the phone while it has a connection. It picks up the new boundaries, stands and plots within about a minute. Tap the map icon at the bottom of Project Home to save the map for offline use. If the phone had already saved this project’s map and you made the boundary bigger, download the map again too: Settings › Caching, tap the project, then ↻ next to the map (Chapter 7, section 7.7).
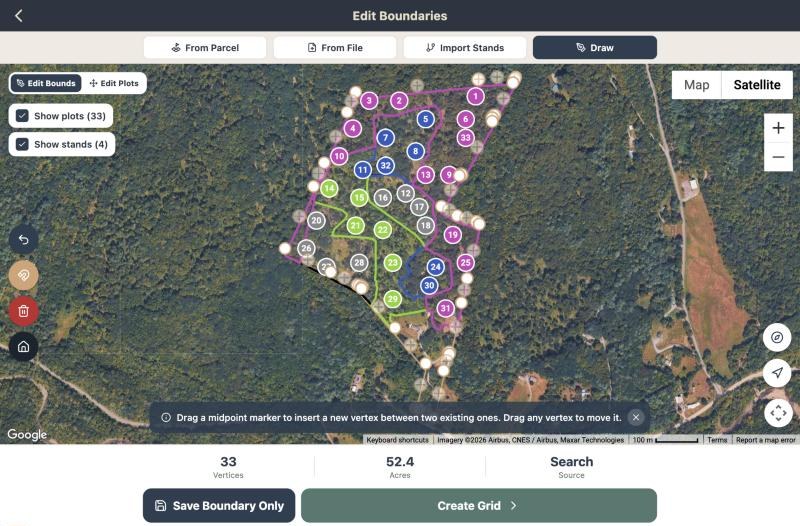
In the browser, the instructions in this chapter translate like this:
| On the phone | In the browser |
|---|---|
| Tap | Click. |
| Drag a corner or a plot | Click and drag it. Zoom in first to place it precisely. |
| Long-press a corner to remove it | Click the corner. Hold the pointer over a corner to see which one it is. |
| Pinch to zoom | Scroll wheel or trackpad, or the + and − buttons. |
| Pick a file in Files | Pick it from your computer’s folders. KML and GeoJSON files from a GIS are usually on the computer already, so imports are easier there too. |
You can be signed in on a phone and a computer at once (Chapter 1). Don’t edit the same boundary on both at the same time, or one set of changes can overwrite the other.
3.2The project boundary
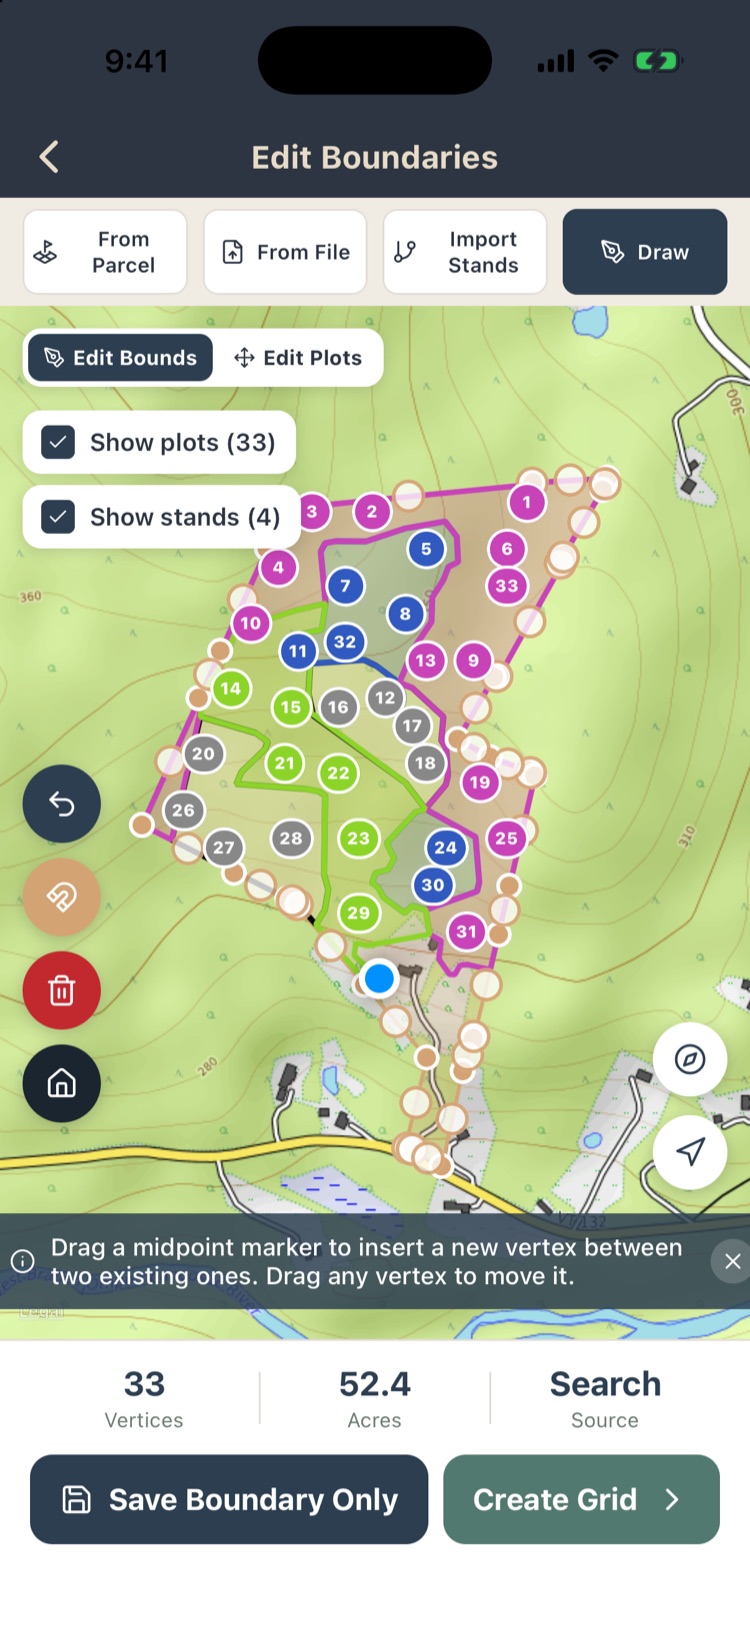
On Project Home, tap the Edit Boundaries card. It reads Set Boundaries until a boundary exists. Across the top are four ways to make one:
- From Parcel Max picks tax parcels off a map. Needs a connection.
- From File reads a polygon from a KML or GeoJSON file.
- Import Stands builds the stands and the boundary together from a file of stand polygons (section 3.8).
- Draw lets you tap the corners onto the map yourself.
Along the bottom, the app shows the number of Vertices (corners), the Acres inside, and the Source: Drawn, File or Search (parcel). Show plots and Show stands overlay the existing plots and stand outlines so you can line the boundary up against them.
Picking a tax parcel
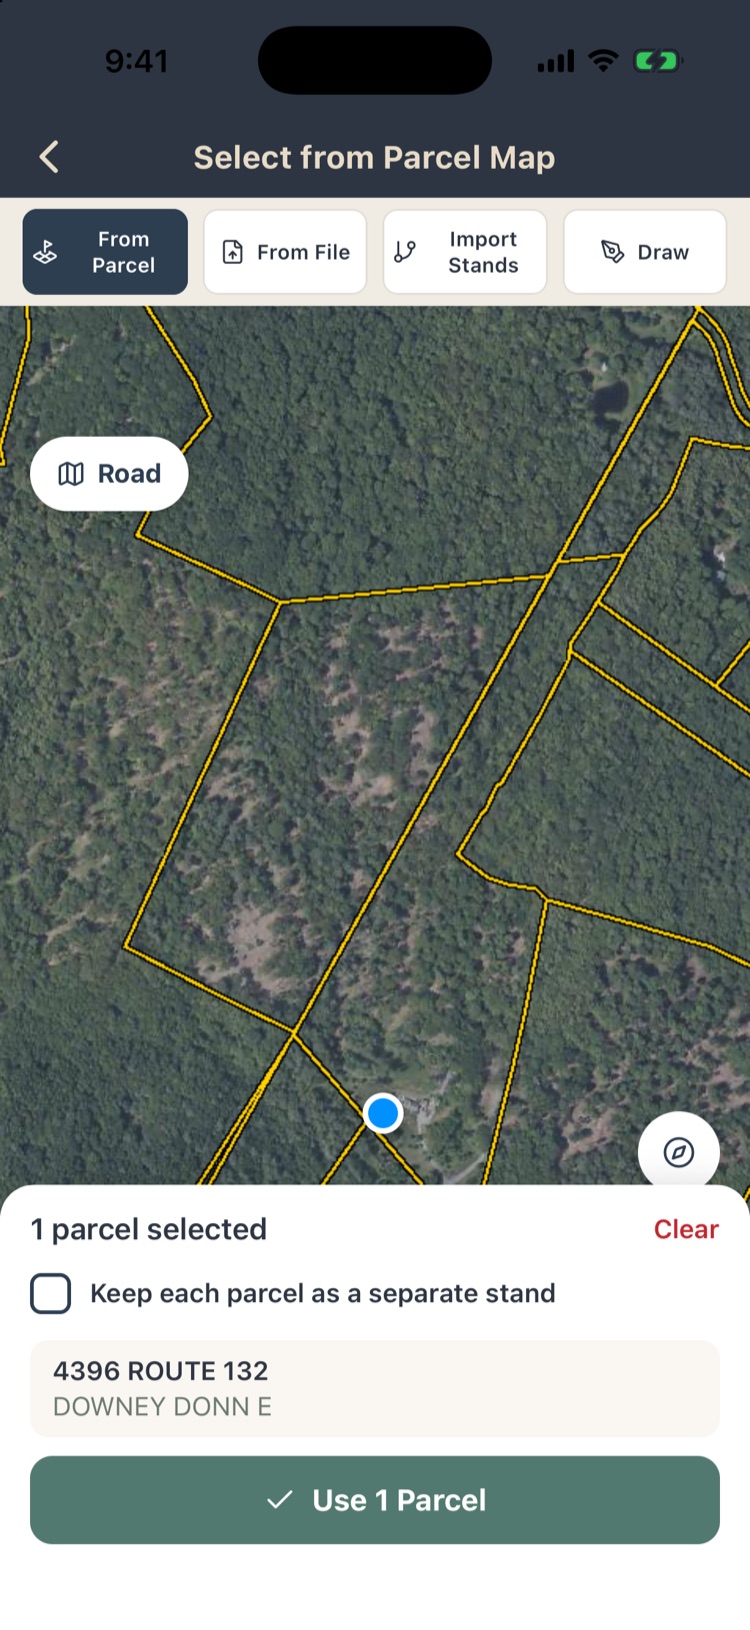
From Parcel opens Select from Parcel Map, with county parcel lines in yellow over the imagery.
- Pan to the property. Road switches to a street map if that helps you find it.
- Tap each parcel that makes up the property. Tap a selected parcel again to drop it.
- The panel at the bottom lists each selected parcel with its address and owner of record. Clear starts over.
- Tap Use Parcels. Parcels that touch become one outline; parcels that don’t become separate pieces of the same boundary. Stand 1 takes the whole boundary.
With more than one parcel selected, tick Keep each parcel as a separate stand to make each parcel its own stand instead.
The owner of record fills in Parcel Owner on the project, and the location fills in if it was blank.
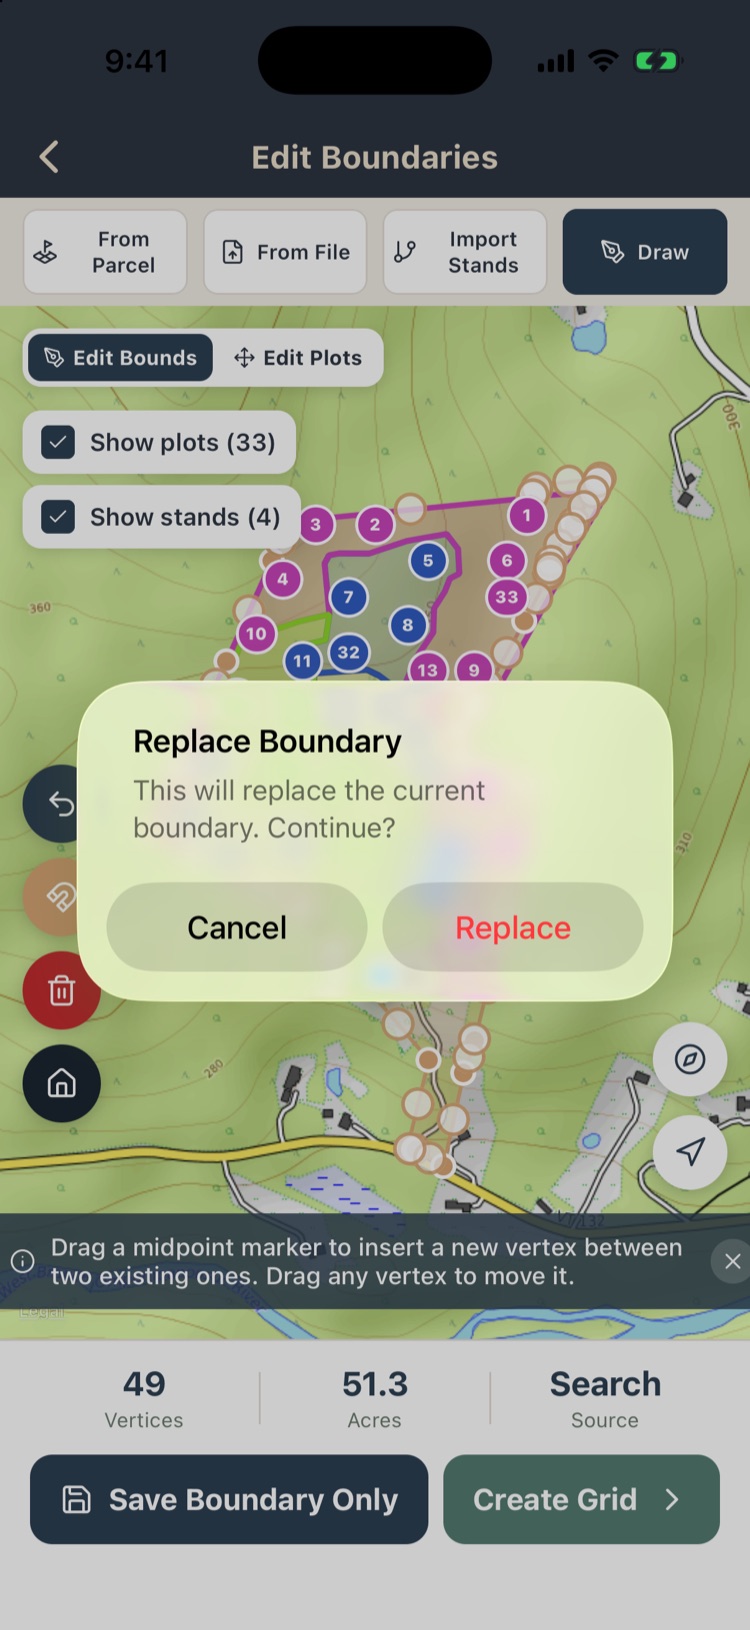
If the project already has a boundary, the app asks before replacing it. Nothing changes until you tap Use Parcels.
From a file
From File opens your phone’s file picker. Choose a .kml, .geojson or .json file containing a polygon, for example one exported from Google Earth or a GIS. The outline replaces the current boundary and the map zooms to it. Shapefiles can’t be read directly: convert them to KML or GeoJSON first.
Drawing and editing
- Add a corner: in Draw mode, tap the map. You need at least three.
- Move a corner: drag it.
- Add a corner between two others: drag the small midpoint marker on the edge between them.
- Remove a corner: tap it (or long-press), then confirm. A boundary can’t drop below three corners.
The buttons on the left side of the map:
| Button | What it does |
|---|---|
| Undo | Reverses the last change: a move, an added or removed corner, or a snap. |
| Snap (magnet) | Moves boundary corners within 100 ft of a stand corner or edge onto it, so the boundary and the stands share an edge. If nothing is that close, it offers to try 300 ft. |
| Clear (trash) | Removes every corner so you can start over. Asks first. |
| Home | Returns to Project Home. |
Tracing a boundary along a road, a wall or a change in the canopy is much easier on a computer, where the same editor fills the screen (section 3.1).
When you are done, tap Save Boundary Only to keep the boundary and return to Project Home, or Create Grid to save it and go on to lay out plots (section 3.4).
3.3Moving plots on the map
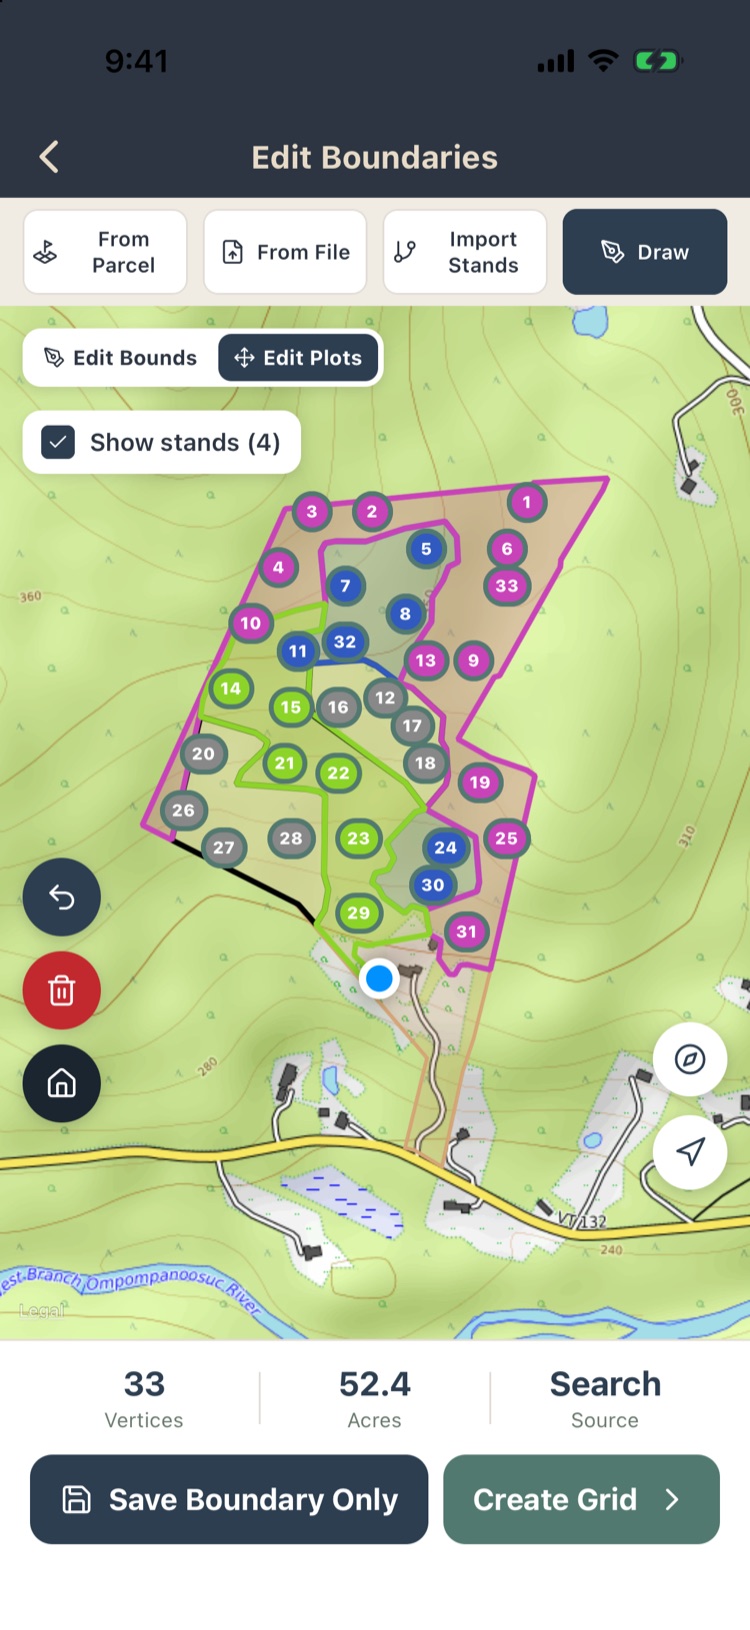
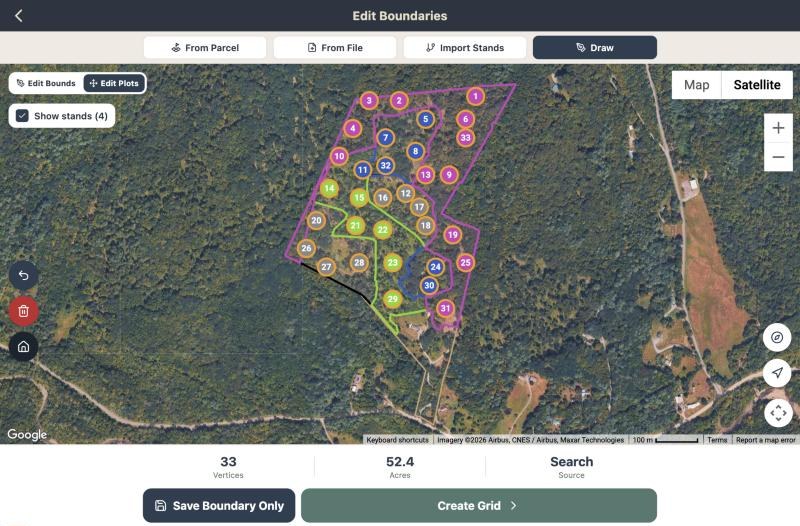
The boundary editor has two modes, chosen above the map: Edit Bounds moves boundary corners, and Edit Plots moves plots. In Edit Plots mode the corners are locked and every plot with a location can be dragged.
- Drag a plot to its new spot. The move is saved as soon as you let go.
- Undo puts the most recently moved plot back where it was.
- A plot dragged into a different stand moves to that stand (section 3.10).
Use this to nudge a grid point off a road or out of a pond before anyone walks to it. Plots you add by hand have no location until the first tree is tallied on them; then the app records the GPS position automatically (Chapter 4).
Moving plots is one of the jobs best done in a browser (section 3.1): zoom in on the imagery, then click and drag each plot clear of the road, the pond or the clearing.
3.4Laying out plots
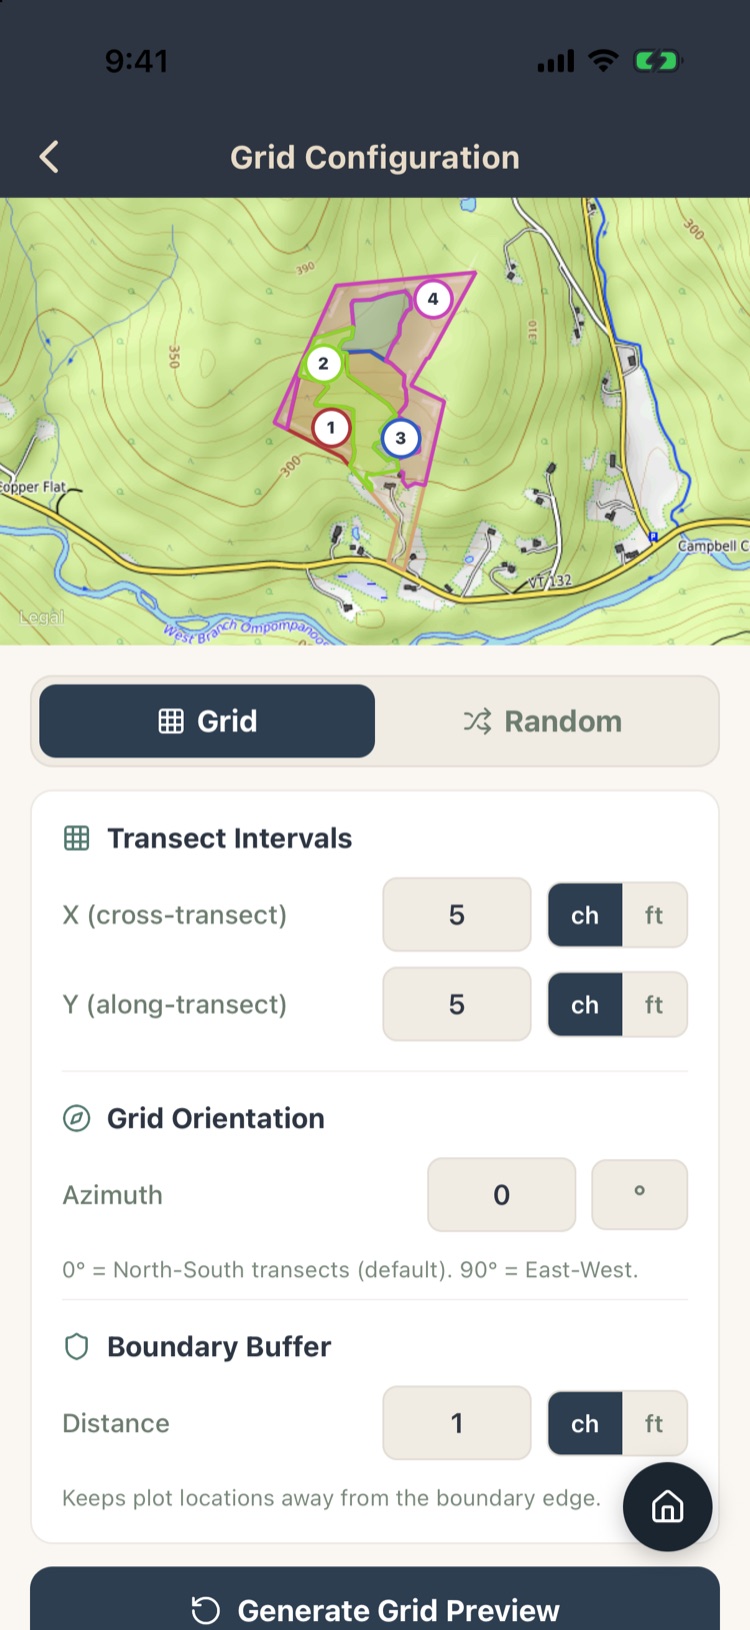
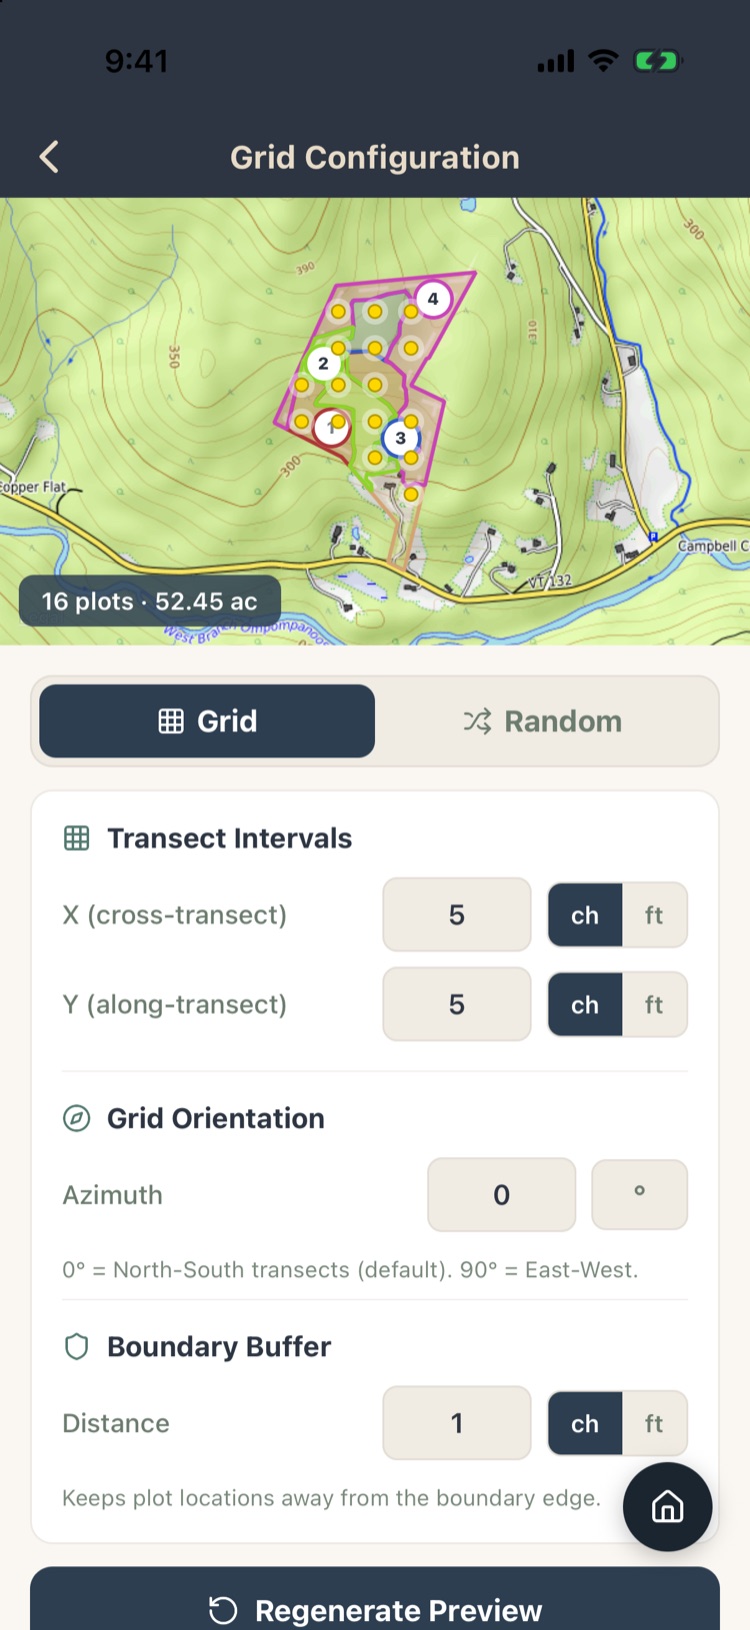
With a boundary saved, tap Create Grid in the boundary editor to open Grid Configuration. Choose a systematic Grid or a Random layout, adjust the settings, then tap Generate Grid Preview. The proposed plots appear on the map with a count and the acreage. Change any setting and tap Regenerate Preview until you are happy, then tap Create N Plots from Grid.
If the project already has plots, creating new ones deletes all of them, along with any trees, regeneration and other data recorded on them. The app warns you and asks you to confirm Delete & Replace. Lay out the grid before the crew starts tallying. To add plots to a project that already has data, use Densify (section 3.11).
Grid
- Transect Intervals. X (cross-transect) is the distance between transect lines; Y (along-transect) is the distance between plots on a line. Enter each in chains or feet. A 5 × 5 chain grid is one plot per 2.5 acres.
- Grid Orientation. The azimuth of the transect lines: 0° runs them north–south, 90° east–west. Turn the grid to run along the slope or square with a road.
- Boundary Buffer. Keeps plots this far inside the boundary so none land on the line.
Random
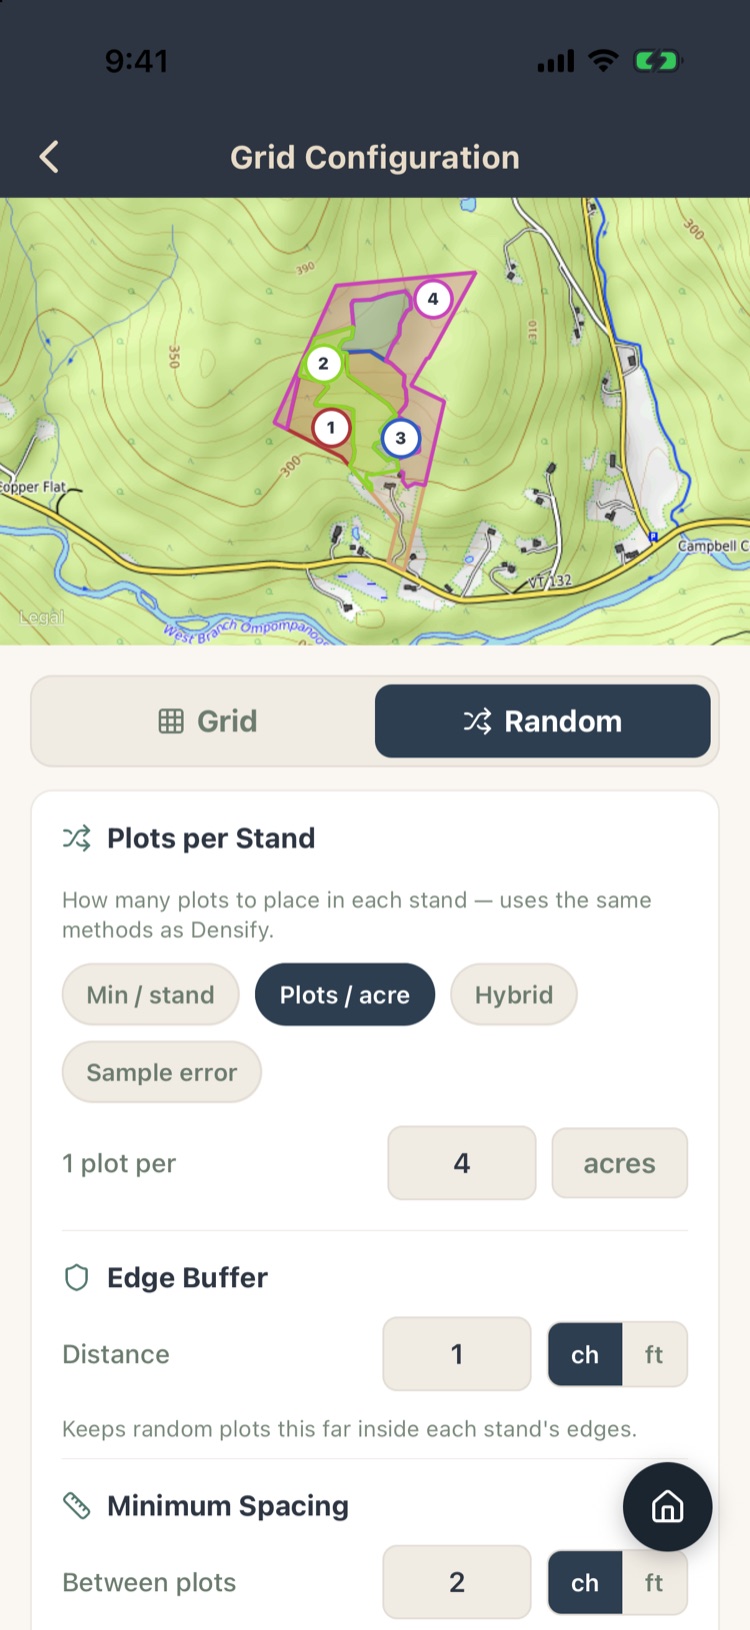
A random layout places plots inside each stand. If you haven’t drawn stands yet, it treats the whole property as one area; once you’ve drawn the stands, plots move into them by location (section 3.10), and you can add more where needed with Densify (section 3.11). Plots per Stand sets how many, using the same four methods as Densify (section 3.11):
- Min / stand: at least this many plots in every stand.
- Plots / acre: one plot per this many acres.
- Hybrid: whichever of the two gives more.
- Sample error: enough plots to reach a target error on basal area at your chosen confidence, given an estimate of the BA coefficient of variation. Plots are shared out by acreage using n = (z·CV/E)².
Edge Buffer keeps plots this far inside each stand’s edge, and Minimum Spacing re-rolls any plot that lands closer than this to another.
3.5The Stands screen
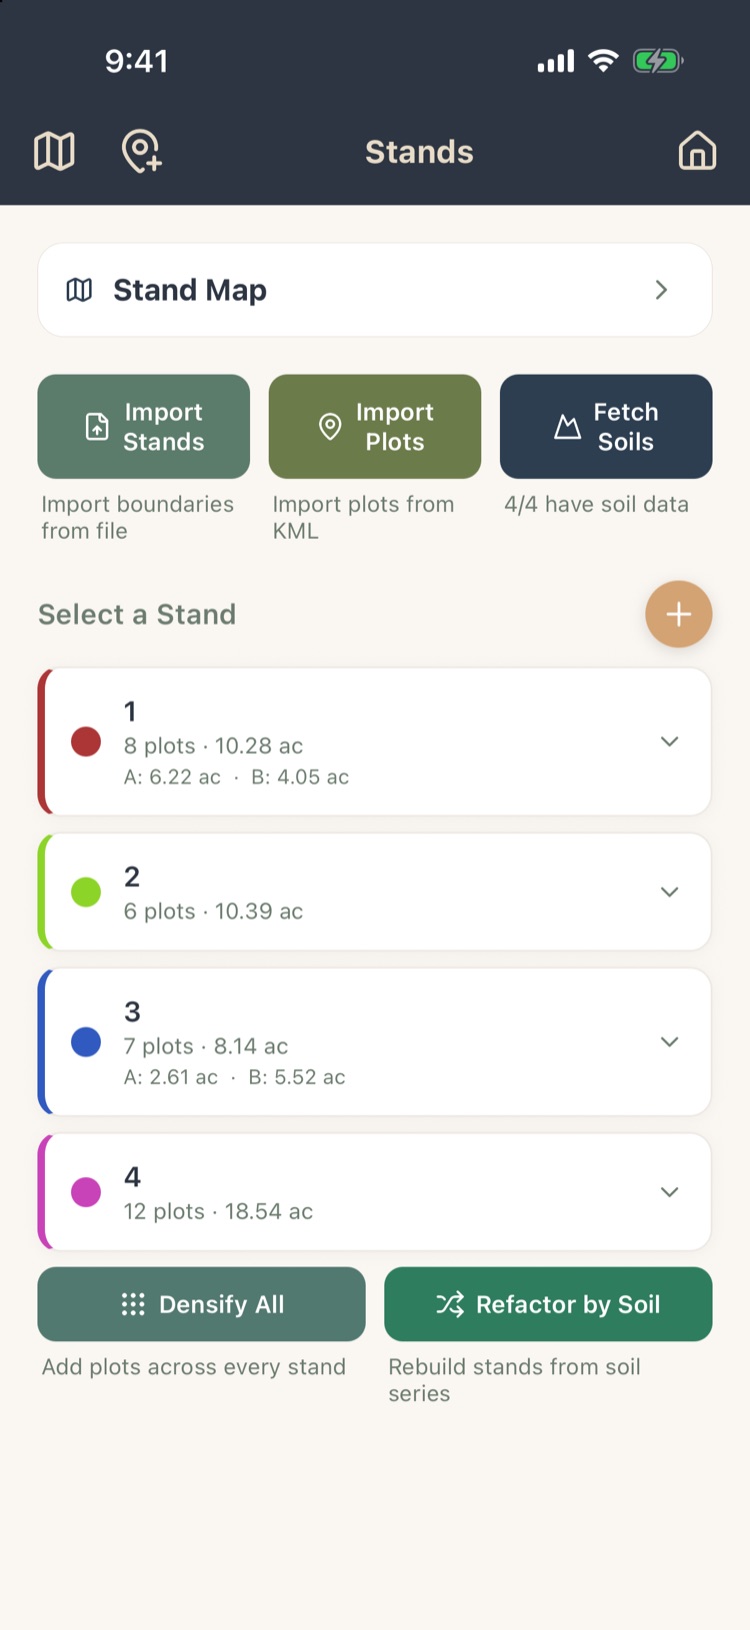
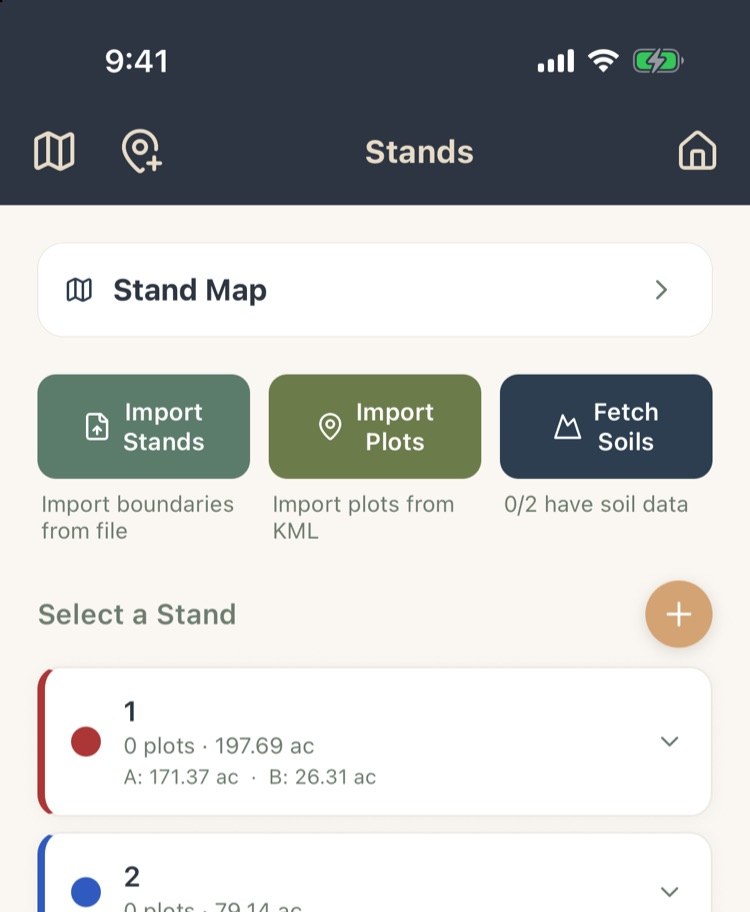
Tap Stands at the top of Project Home. The screen opens with the stand map collapsed, three tools, then your stands:
- Import Stands and Import Plots read stand polygons and plot points from files (section 3.8).
- Fetch Soils Max downloads NRCS soil data for every stand with a boundary (section 3.12). The caption shows how many have it.
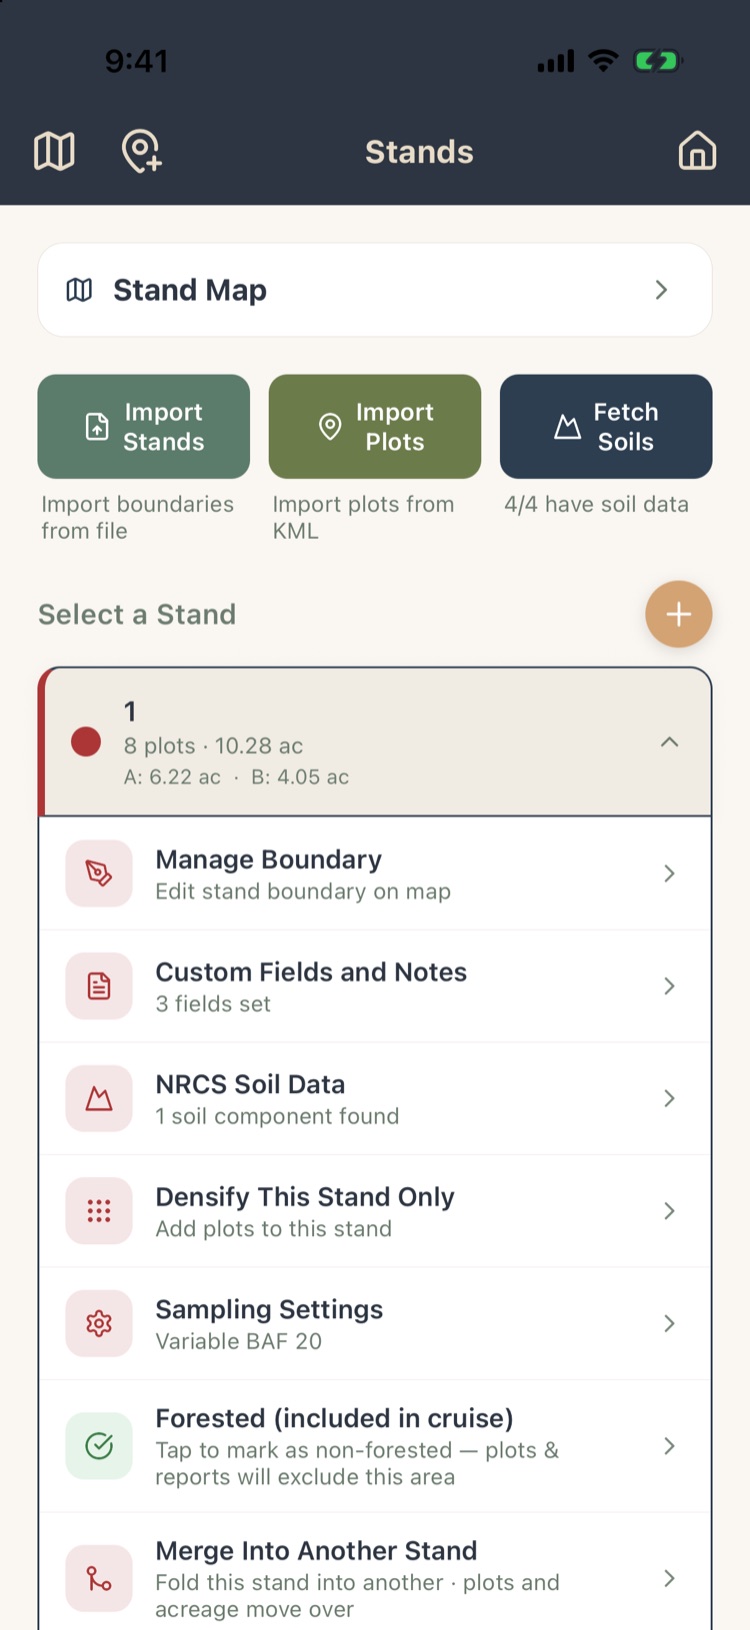
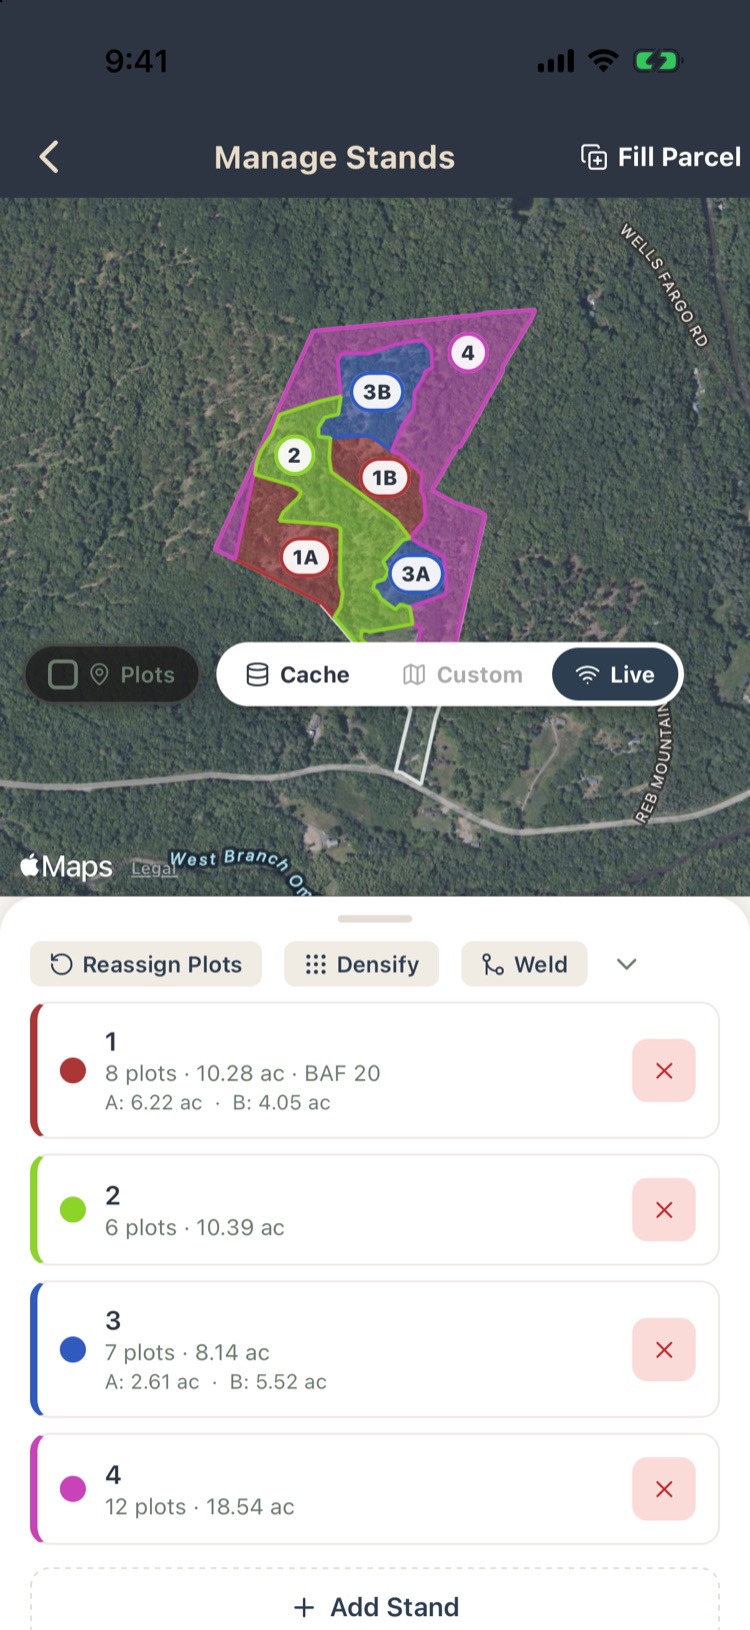
- Each stand card shows its number and color, its plot count and acreage. A stand made of more than one piece lists each one: A: 6.22 ac · B: 4.05 ac.
- Tap + to add a stand (section 3.6), or a stand’s card to open its actions (section 3.9).
Below the list, Densify All adds plots to every stand (section 3.11) and Refactor by Soil Max rebuilds the stands from soil series (section 3.12).
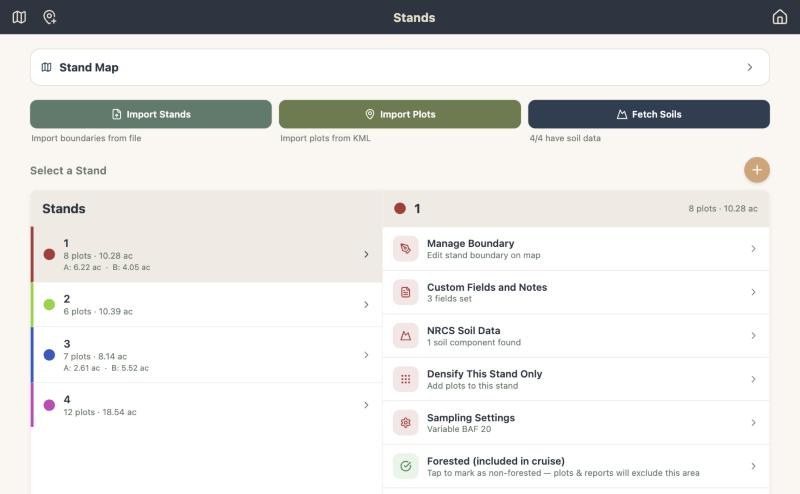
In a browser window, the stand list and the selected stand’s actions sit side by side, so you can work down the stands without going back and forth.
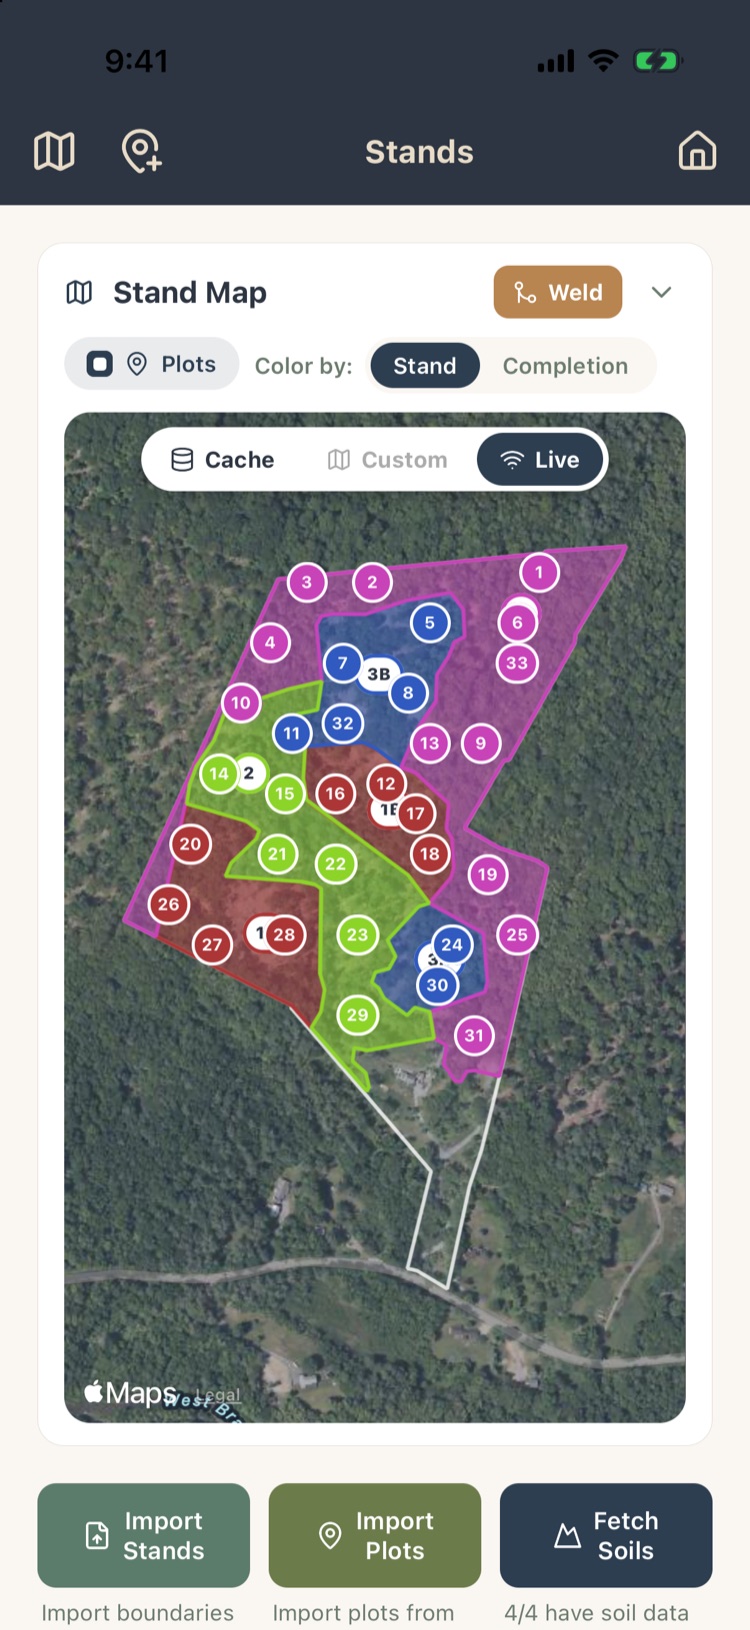
The stand map
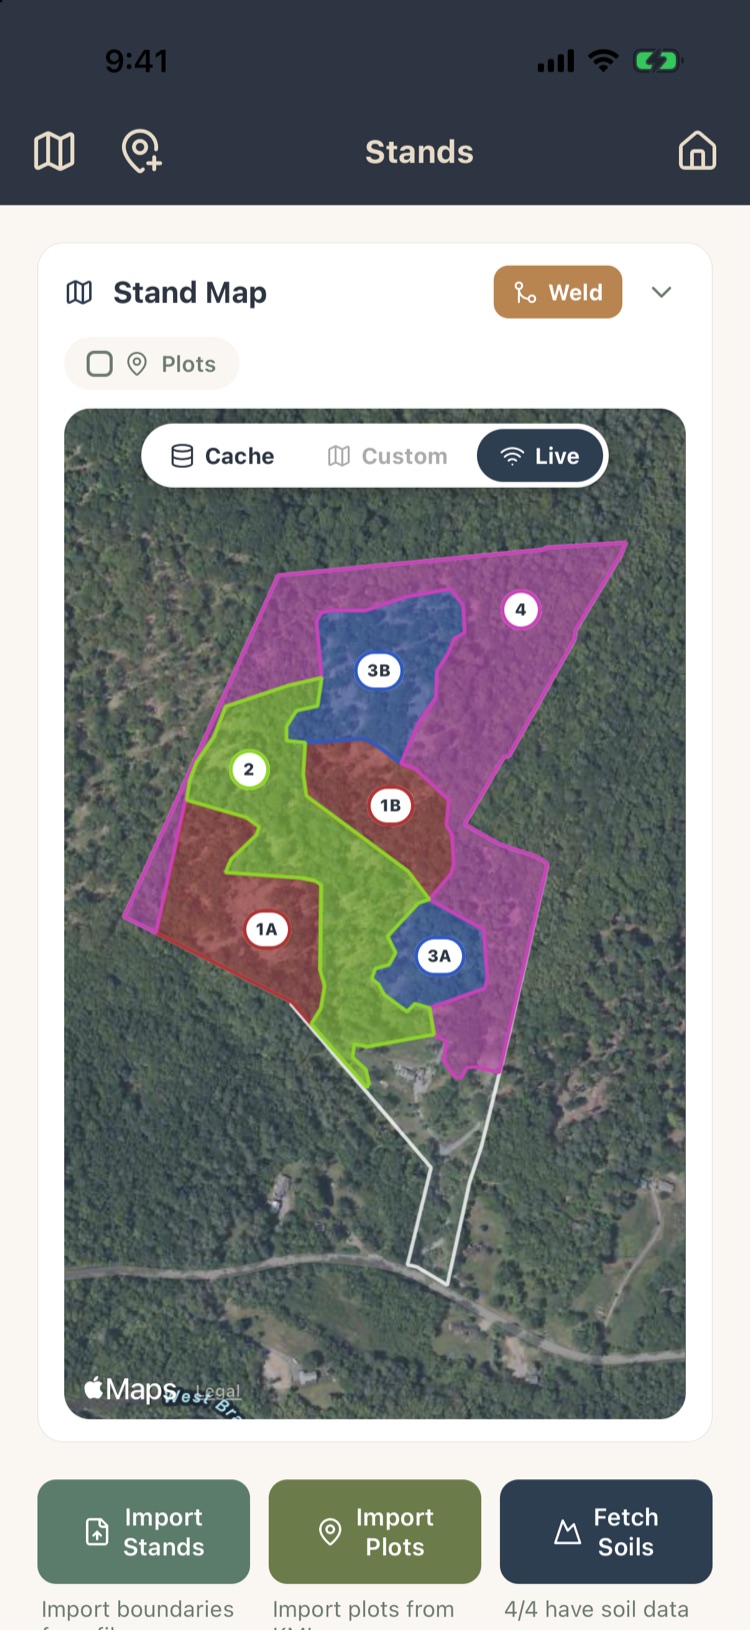
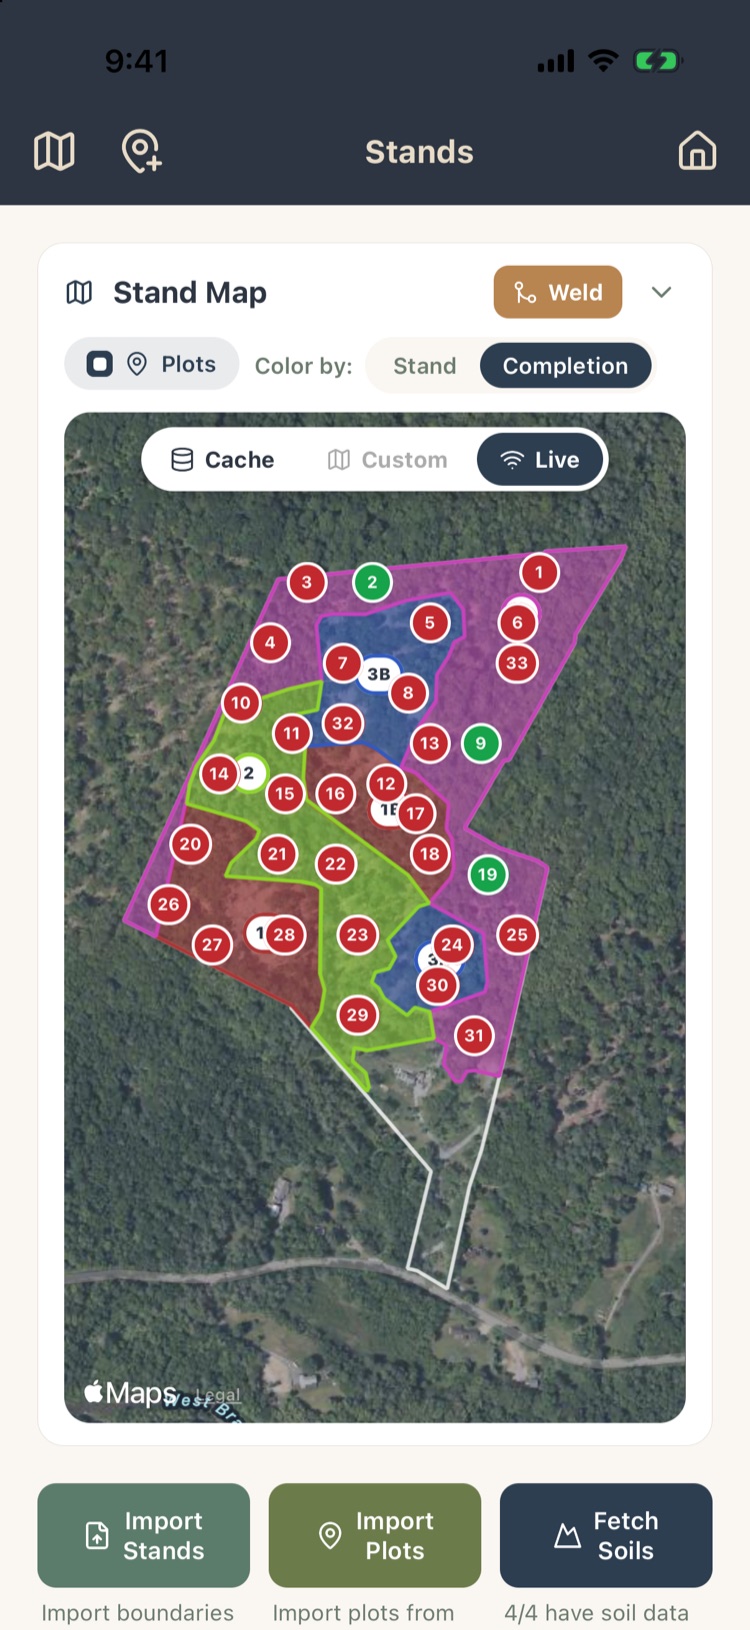
Tap Stand Map to open it. Each stand is filled in its color and labeled with its number; separate pieces of one stand are lettered (1A, 1B).
- Plots overlays the plot numbers. Color by Stand colors each plot by its stand; Completion colors visited plots green and unvisited ones red, which makes it easy to see what’s left to cruise.
- Cache, Custom and Live choose the map source: offline tiles you saved, a custom map you imported, or live imagery (Chapter 7).
- Weld lines up stand edges that should touch but were drawn a little apart. Give it a distance in feet; it previews how many shared borders it found, then aligns them when you apply.
3.6Adding a stand
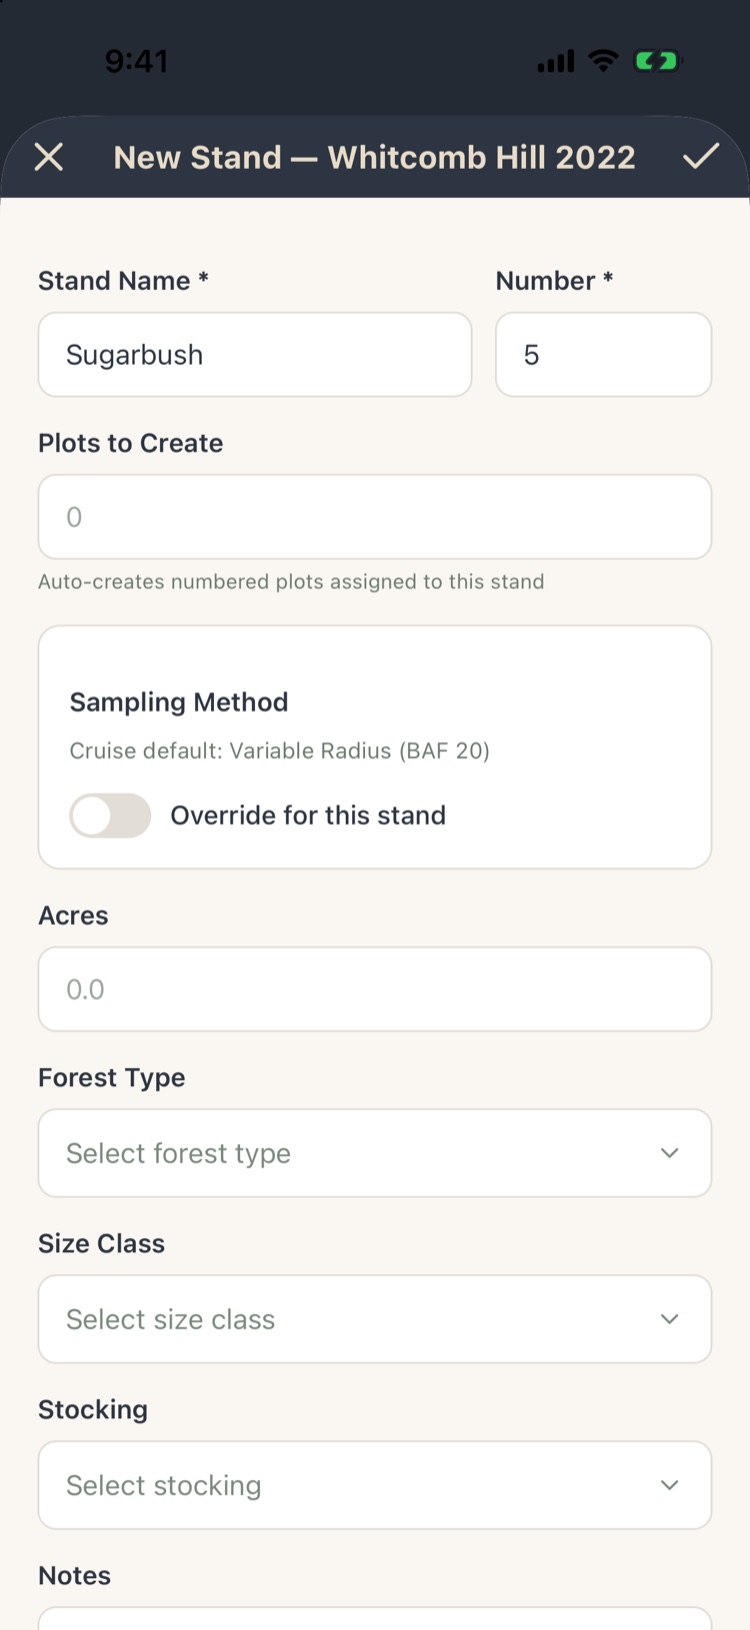
On the Stands screen, tap +.
- Stand Name and Number are required. The number fills in with the next one free.
- Plots to Create makes that many numbered plots in the new stand straight away, without locations. Handy when you’ll find the plots in the field. Leave it at 0 to add plots later.
- Sampling Method shows the project’s default. Turn on Override for this stand to give this stand its own BAF, plot size or a 100% tally.
- Acres and Notes are optional. Acres fills in from the boundary once you draw one.
- Your stand fields (Forest Type, Size Class and Stocking here) come from Settings › Stand Optional Fields (Chapter 10). Fill them now or later under the stand’s Custom Fields and Notes (section 3.9).
Tap the check mark. In Pro and Max the app goes straight to the map so you can draw the stand’s boundary (section 3.7).
3.7Drawing a stand boundary
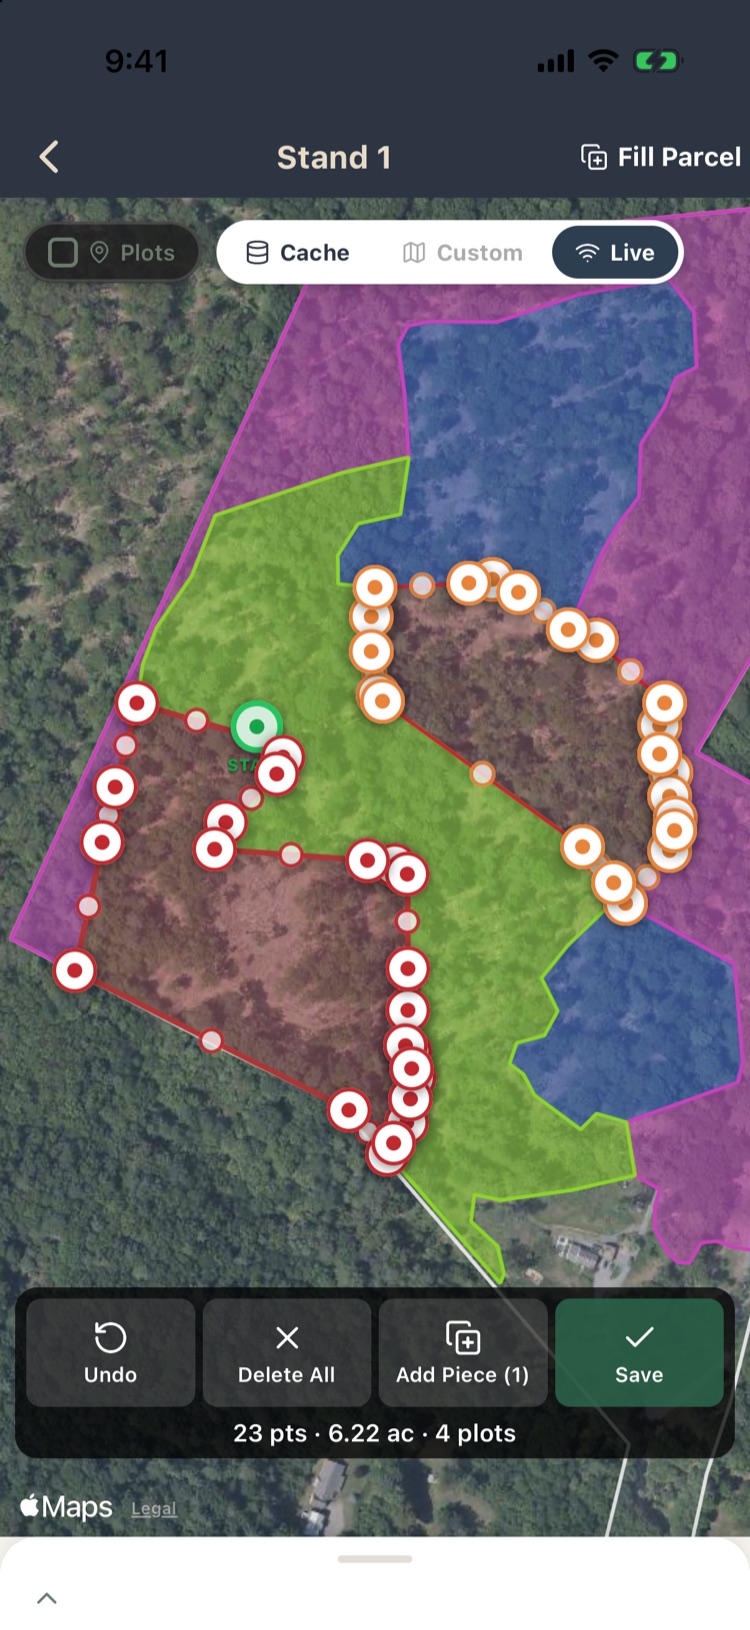
Open a stand’s actions and tap Manage Boundary. The map shows this stand’s outline with its corners, other stands around it, and the project boundary.
- Tap the map to add corners. Drag a corner to move it, drag a midpoint marker to insert one, long-press a corner to remove it.
- Corners snap to the project boundary and to neighboring stands when you drop them close, so stands share edges without gaps or overlaps.
- Orange corners belong to this stand’s other pieces. Drag them to edit that piece.
- Add Piece starts a separate piece of the same stand, for a stand split by a road or a field. Finish the current piece (three corners or more) first.
- Fill Parcel at the top right makes this stand cover all the parcel that no other stand has claimed. It’s the quickest way to draw the last stand.
- Undo reverses the last change; Delete All clears the corners you are drawing.
The strip along the bottom shows the corner count, acreage and number of plots inside. Tap Save when you are done. Plots are reassigned to stands by location as soon as you save.
Carving stands out of Stand 1
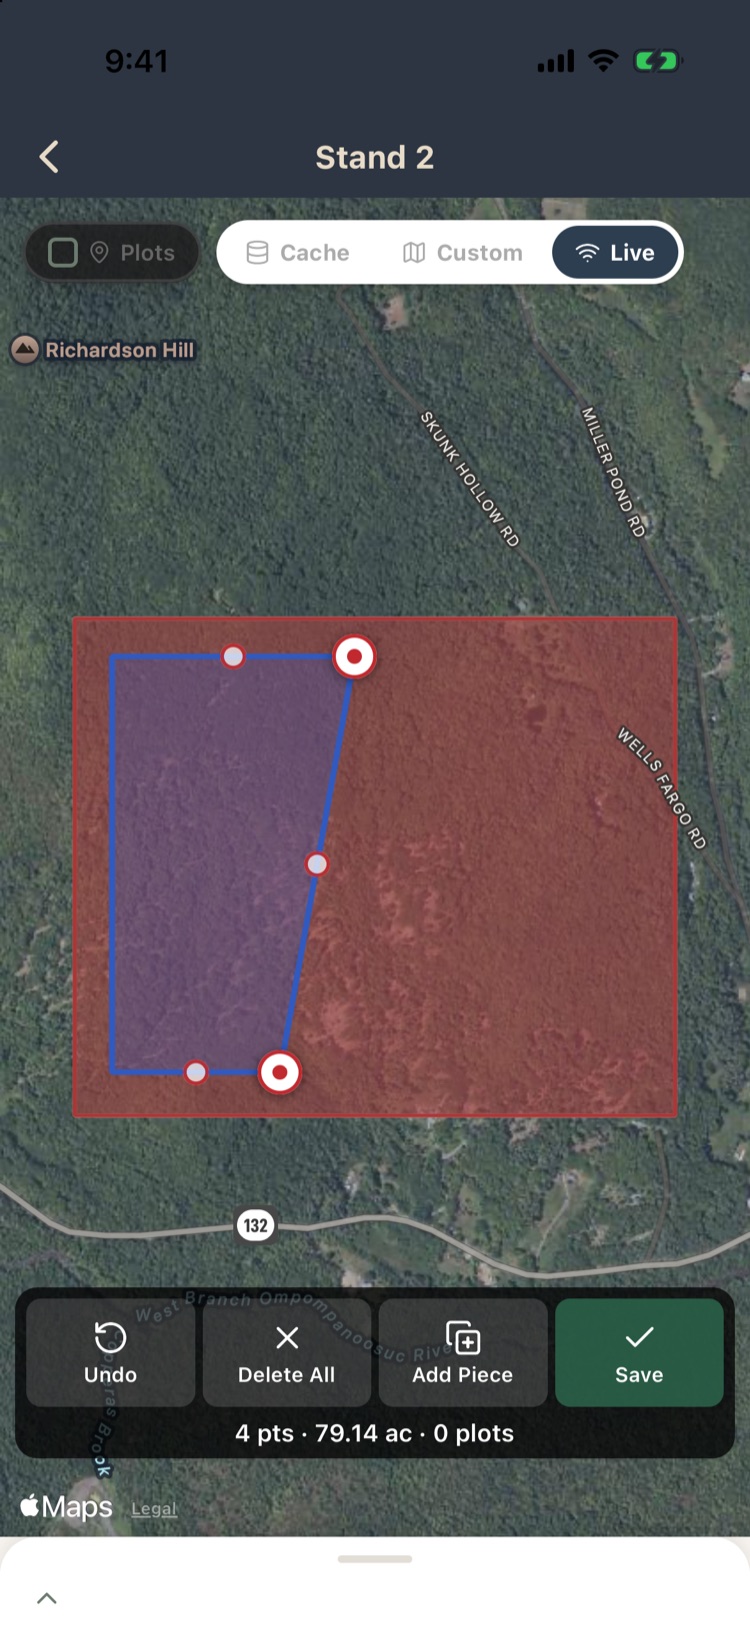
Every project starts with one stand. When you draw the project boundary, Stand 1 takes all of it. The easiest way to divide the property is to leave Stand 1 alone and draw the other stands inside it:
- On the Stands screen, tap + to add Stand 2 (section 3.6). The map opens.
- Draw Stand 2’s boundary over the part of Stand 1 it should take, and tap Save.
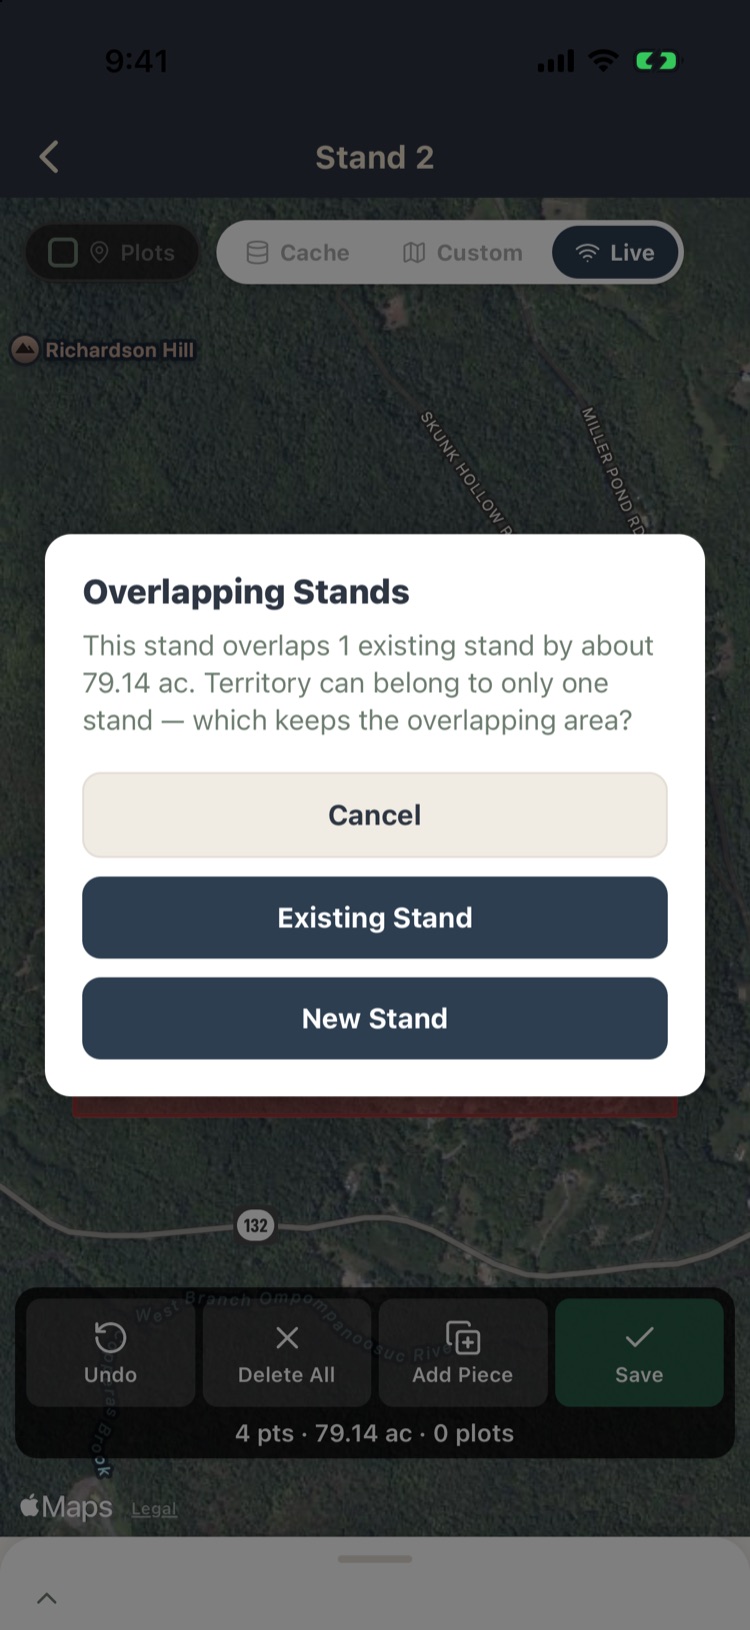
- The app sees the overlap and asks which stand keeps that ground. Choose New Stand. Stand 1 shrinks to whatever is left.
- Repeat for each stand. Stand 1 ends up as the remainder, so you never have to drag its corners back. If a new stand sits in the middle of Stand 1, Stand 1 is left in parts (A, B) on either side of it.
Choosing Existing Stand instead trims the new stand to the open ground. Plots move to their new stands as soon as you save.
Drawing stands in a browser
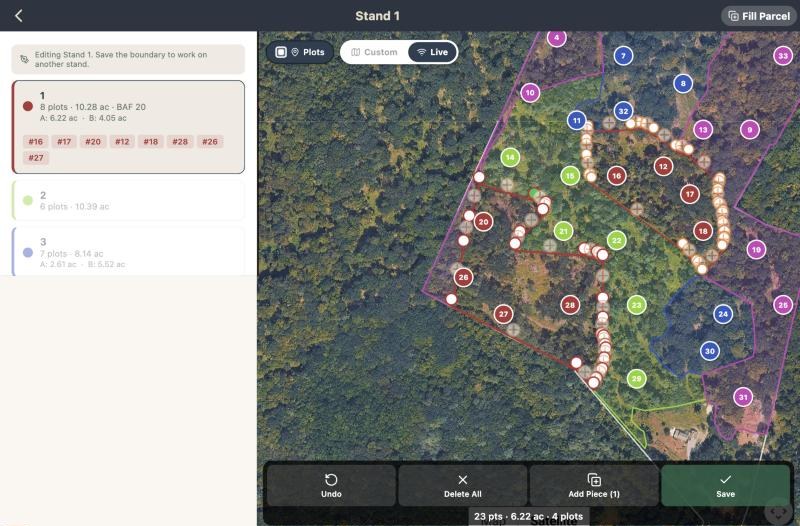
This is where a computer helps most. A stand line follows what you can see in the imagery (a change in the canopy, a stone wall, a brook), and you can zoom in far enough to place each corner on it. In a browser:
- The stand list runs down the left, with the selected stand’s plot numbers. Click another stand to edit it next; save the one you’re on first.
- Click the map to add a corner, drag a corner to move it, and click a corner to remove it.
- Turn on Plots to see which plots fall inside as you draw.
3.8Importing stands and plots
If the stands were mapped in a GIS or Google Earth, import them instead of drawing them. Use a KML file with one named polygon placemark per stand, or a GeoJSON file with one feature per stand.
From the Stands screen
Import Stands on the Stands screen adds boundaries to the project you have. After you pick the file, the app shows each shape on a small map.
- Tap a shape to highlight it, then type its stand number.
- A number that matches an existing stand attaches the boundary to that stand. Any other number creates a new stand. Give two shapes the same number to make one stand with two pieces.
- Switch on Skip for any shape you don’t want.
- If a shape overlaps an existing stand, the app asks which stand keeps the overlapping ground before it applies anything.
From the boundary editor
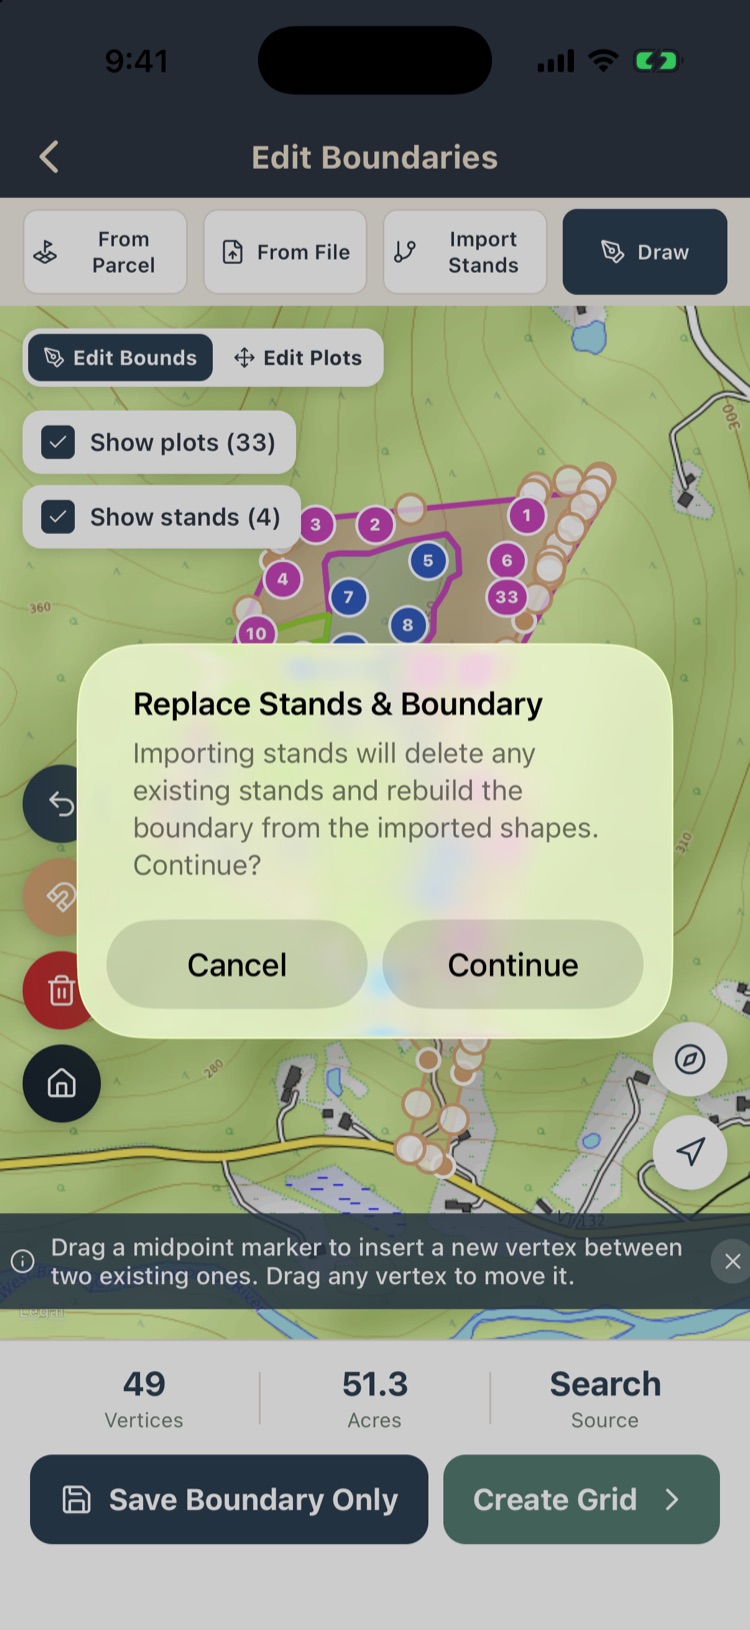
Import Stands in the boundary editor starts over: it deletes every existing stand and builds the stands and the project boundary from the file. The app asks before it does. Every shape needs a stand number you type; nothing is numbered for you. Use this for a new project. Use the Stands screen import to add to one that already has stands.
Plots that already have locations are placed into the imported stands by where they fall.
Importing plots
Import Plots reads plot points from a KML file, such as a plot layout made in another program. The app works out which field in the file holds the plot number and asks if more than one could. Each point goes into the stand it falls in, which you can change before you apply. Plot numbers already in the project are skipped. Chapter 4 covers plot import in detail.
3.9Stand actions
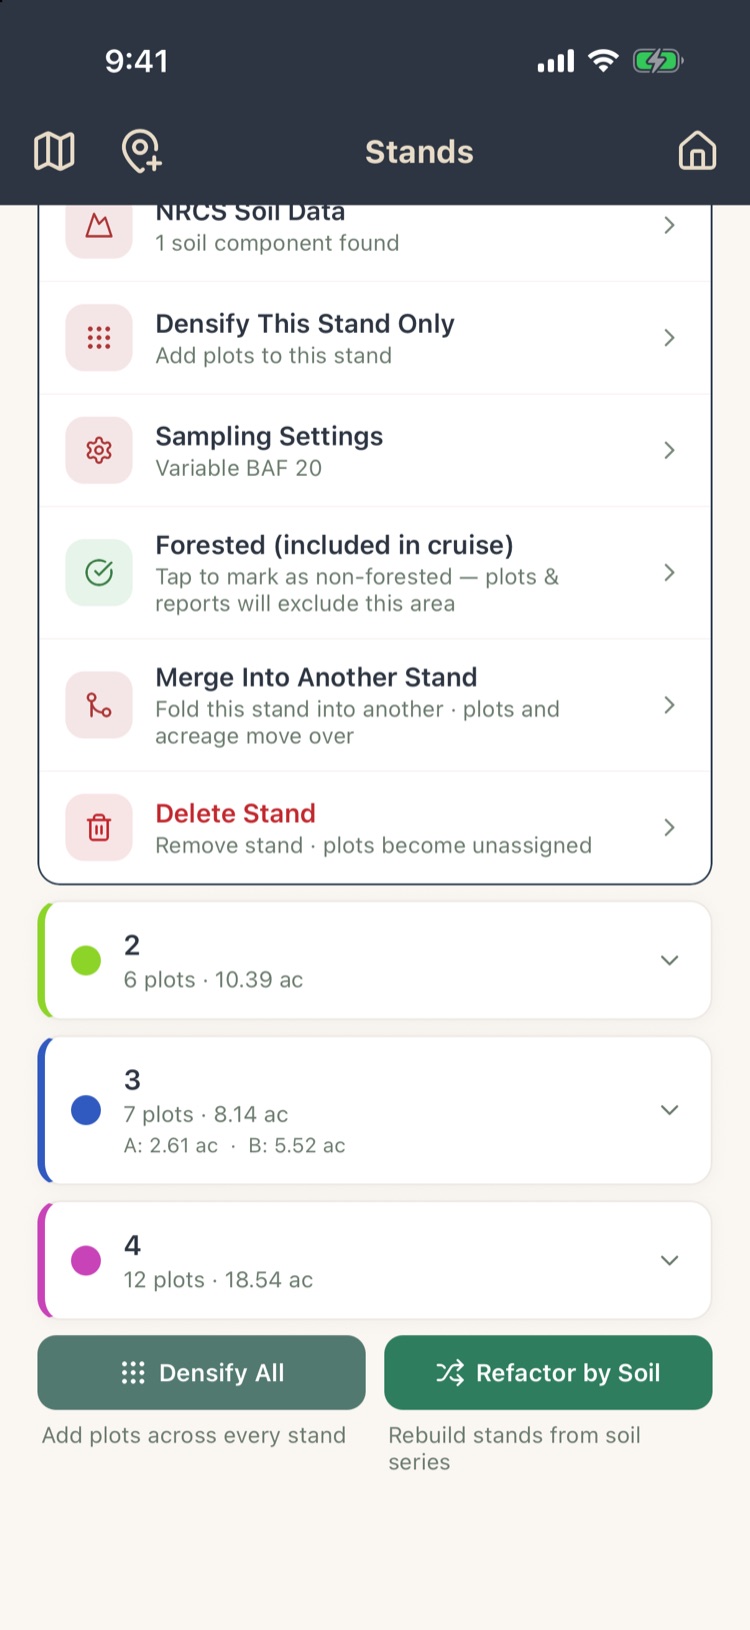
Tap a stand on the Stands screen to open its actions:
| Action | What it does |
|---|---|
| Manage Boundary | Draw or edit the stand’s outline (section 3.7). |
| Custom Fields and Notes | Name, forest type, size class, stocking, acreage, grouping, forested and notes. See below. |
| NRCS Soil Data | Max Soils under this stand (section 3.12). |
| Densify This Stand Only | Max Add plots to this stand (section 3.11). |
| Sampling Settings | Give this stand its own sampling method. |
| Forested | Tap to mark a field, pond or other open ground as non-forested. Its acreage stays in the project but reports leave it out, and Densify and random layouts don’t place plots there. Plots don’t belong in a non-forested stand: any that are inside it are left out of reports. |
| Merge Into Another Stand | Fold this stand into another. Its outline becomes part of the other stand and its plots move over. |
| Delete Stand | Removes the stand. Its plots are kept but belong to no stand until you assign them. |
Fields and notes
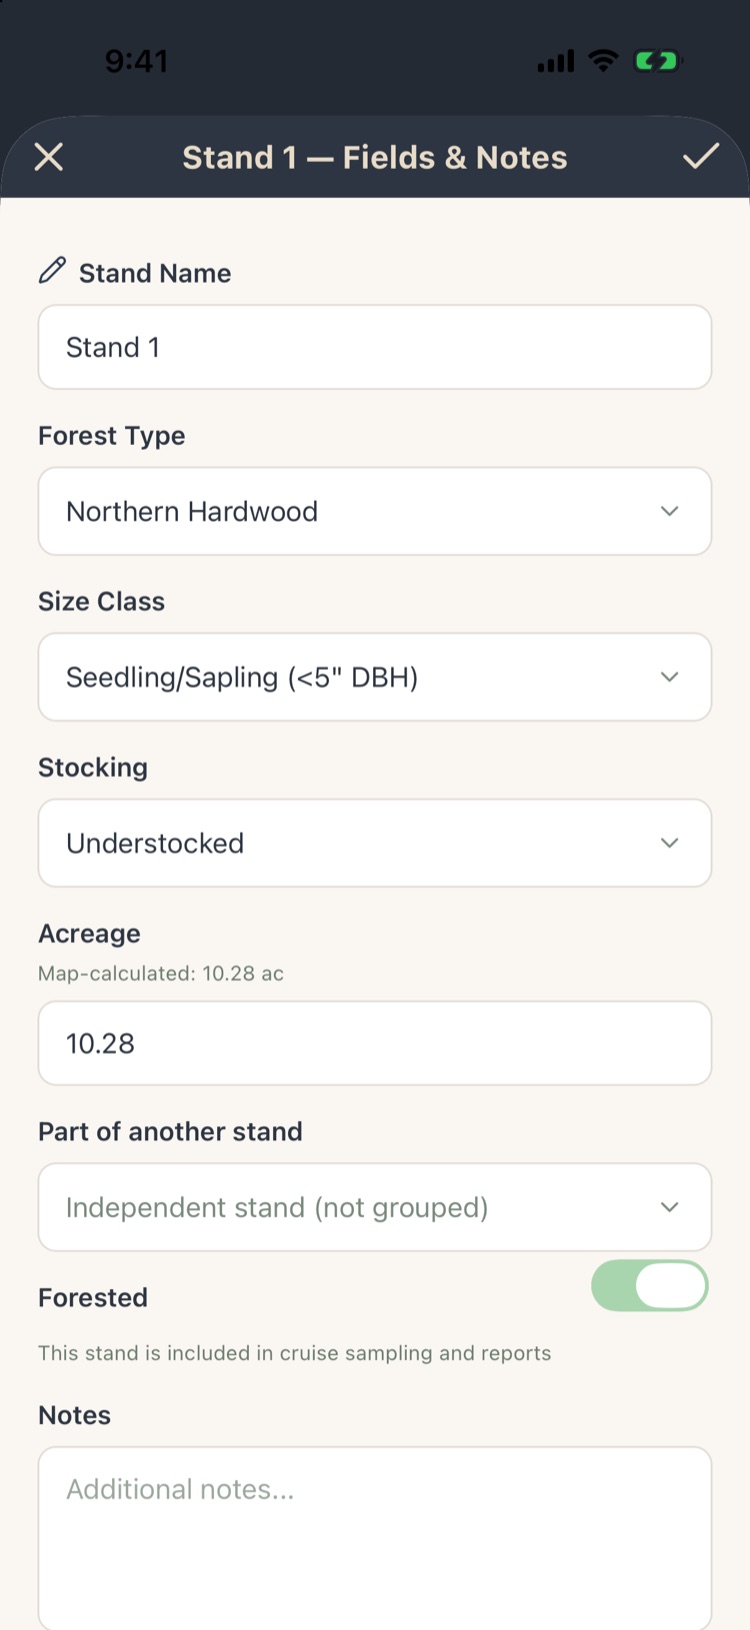
- Stand Name is the only fixed field.
- Below it are your stand fields, such as forest type, size class or stocking: whatever labels you set up under Settings › Stand Optional Fields (Chapter 10). If none are set up, the screen says so.
- Acreage shows the map-calculated area above the box. Type a different figure to override it, for example to match a survey. Reports use the figure in the box.
- Part of another stand groups this stand under a parent, so its plots and tallies roll up into the parent’s totals. Choose Independent stand to undo it.
- Forested is the same switch as the Forested action.
If your template has custom stand fields (Chapter 10), they appear below the notes. Tap the check mark to save.
Sampling settings for one stand
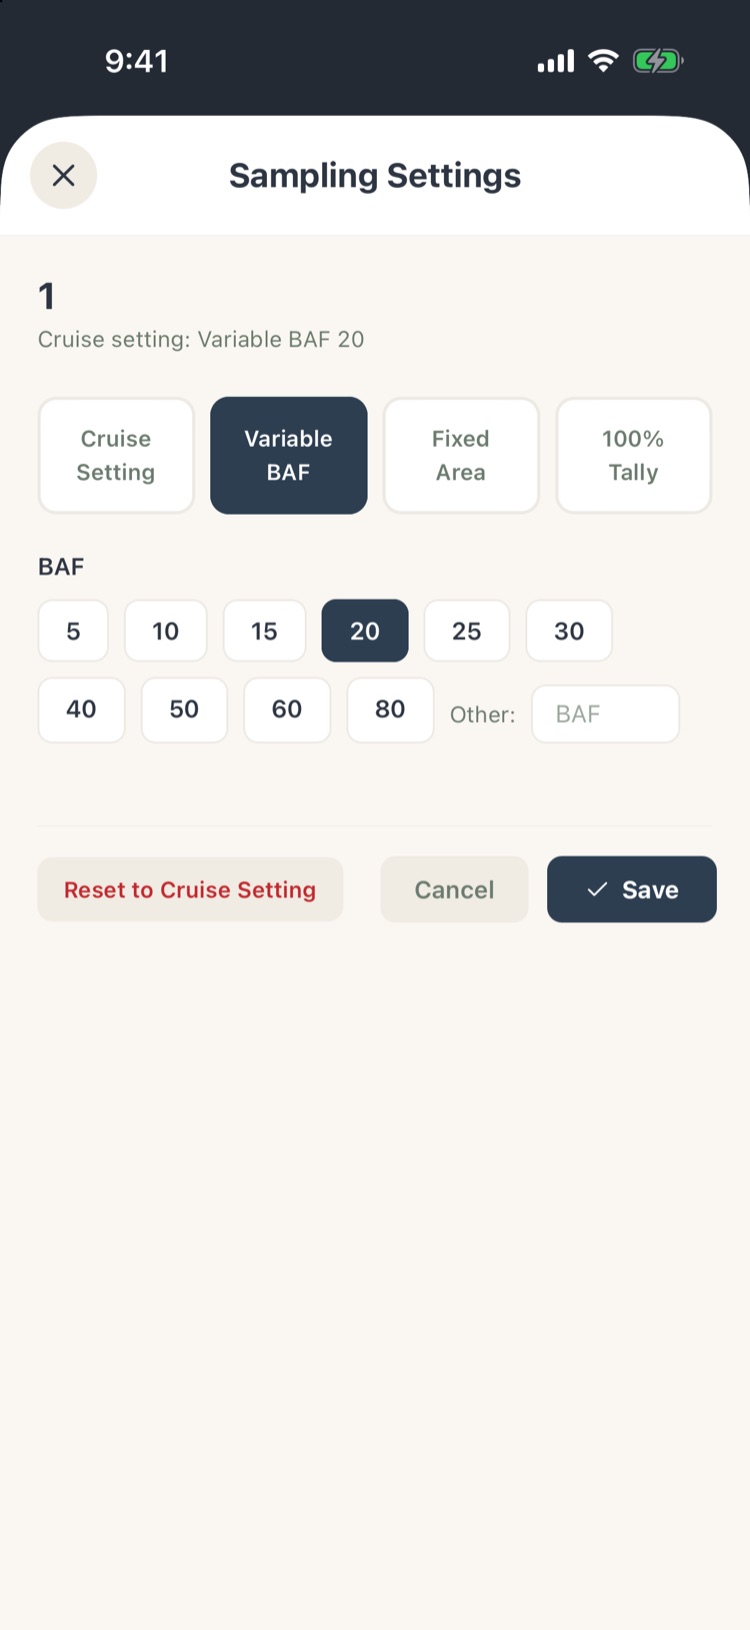
Every stand uses the project’s sampling method unless you change it here. Choose Variable BAF, Fixed Area or 100% Tally and its settings, then tap Save. Reset to Cruise Setting goes back to the project’s method.
Use it when one stand calls for different sampling: a BAF 10 in a young stand where the rest of the property is BAF 20, or a 100% tally in a small, high-value stand.
Trees already tallied keep the method they were recorded with. Changing a stand’s method after work has started mixes two methods in one stand.
Merging stands
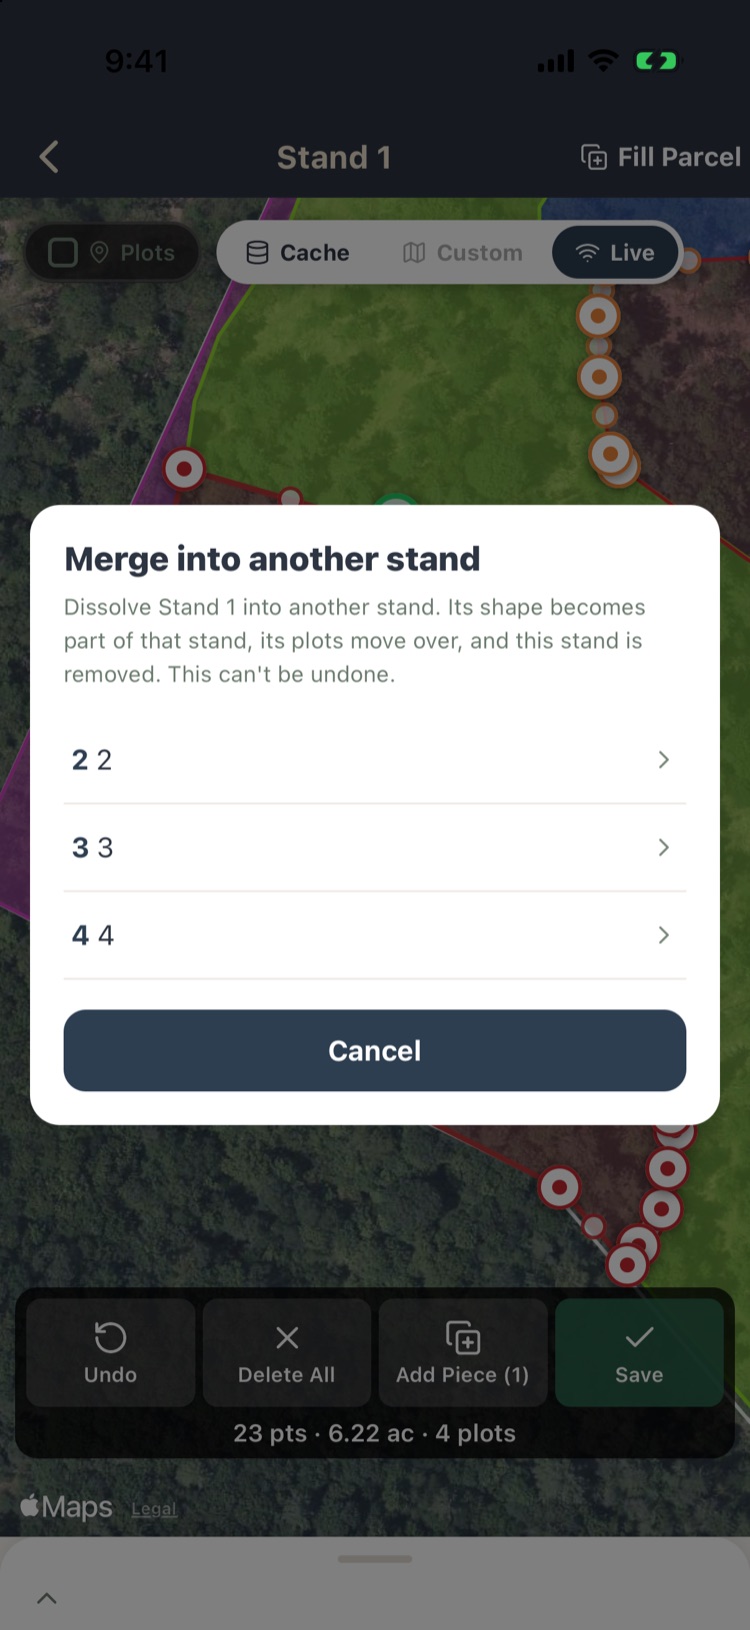
Tap Merge Into Another Stand and choose the stand to merge into. The app summarizes what will move and asks you to confirm. The merged stand’s shape joins the other stand, its plots move over, and it’s removed. This can’t be undone, so check the summary.
To split a piece back out of a stand, open Manage Stands (section 3.10), tap the piece on the map and choose Promote Area to New Stand. Plots inside it move to the new stand. Move Area on the same menu hands a piece to another existing stand.
3.10Which stand a plot belongs to
A plot with a GPS location belongs to the stand whose boundary contains it. The app keeps this up to date for you:
- Plots made by the grid, an import or Densify go into the stand their location falls in. One that falls outside every stand is left unassigned.
- A plot you drag to a new spot (section 3.3) follows it into the right stand.
- When you save a stand boundary, merge stands, weld edges or import stands, plots are reassigned by location.
A plot that moves outside every stand boundary keeps the stand it had, so GPS error at a stand edge can’t drop it from its stand. A plot you placed with Assign Plots stays where you put it. A plot added by hand keeps the stand you chose, even after its first tree records a GPS position.
Manage Stands and Reassign Plots
For an overview of every stand on one map, go to Plots › By Stand and tap the pen on a stand card. Manage Stands lists each stand with its plots, acreage and sampling, with Add Stand at the bottom and Fill Parcel at the top. Tap a stand to select it, or a piece of a stand to promote or move it (section 3.9).
Reassign Plots re-checks every plot that has a location and puts it in the stand that contains it. Plot data is never touched; only the stand each plot belongs to can change. Use it if plots seem to be in the wrong stand after a lot of boundary editing. Densify and Weld work as described in sections 3.11 and 3.5.
Without boundaries
If none of your stands has a boundary (and always in Basic), plots don’t follow location, so you place them yourself:
- Assign Plots, in a stand’s actions, lists every plot with its stand. Filter to Unassigned, sort by number, change stands, and tap Save. Reset All abandons the changes.
- Move Plots to Another Stand (Basic) lets you select plots in one stand and send them to another.
Plots that belong to no stand, for example after deleting a stand, are listed as Unassigned at the bottom of the Stands screen. Assign them as above, redraw a boundary around them, or tap Delete These to delete them for good. Reports leave unassigned plots out and say how many were left out (Chapter 8).
3.11Densifying stands Max
Densify adds plots to stands that already have some, without moving or deleting any. Use it when a stand turns out more variable than expected, or when a grid left a small stand with too few plots.
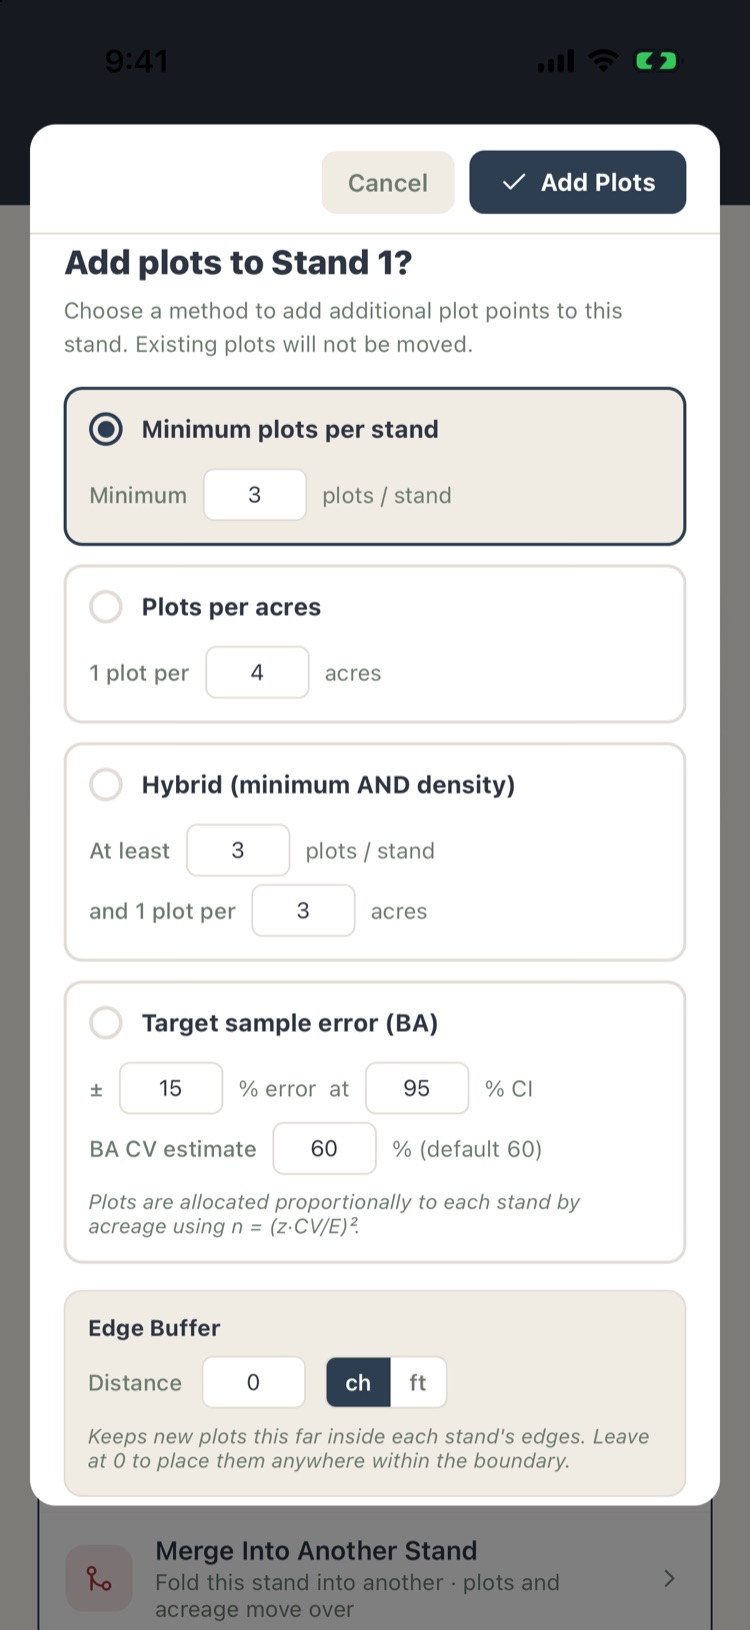
Tap Densify This Stand Only in a stand’s actions, or Densify All on the Stands screen. Choose a method:
- Minimum plots per stand. Bring each stand up to at least this many.
- Plots per acres. One plot per this many acres.
- Hybrid. At least the minimum, and at least one per so many acres.
- Target sample error (BA). Enough plots for ± this percent error at the chosen confidence, using your estimate of the basal-area CV (the default is 60%).
Edge Buffer keeps new plots this far inside the stand edge. Tap Add Plots. The app tells you how many plots it will add in how many stands, and which stands already meet the target, before it adds anything. New plots are numbered on from the existing ones.
Stands without a boundary are skipped.
3.12NRCS soils Max
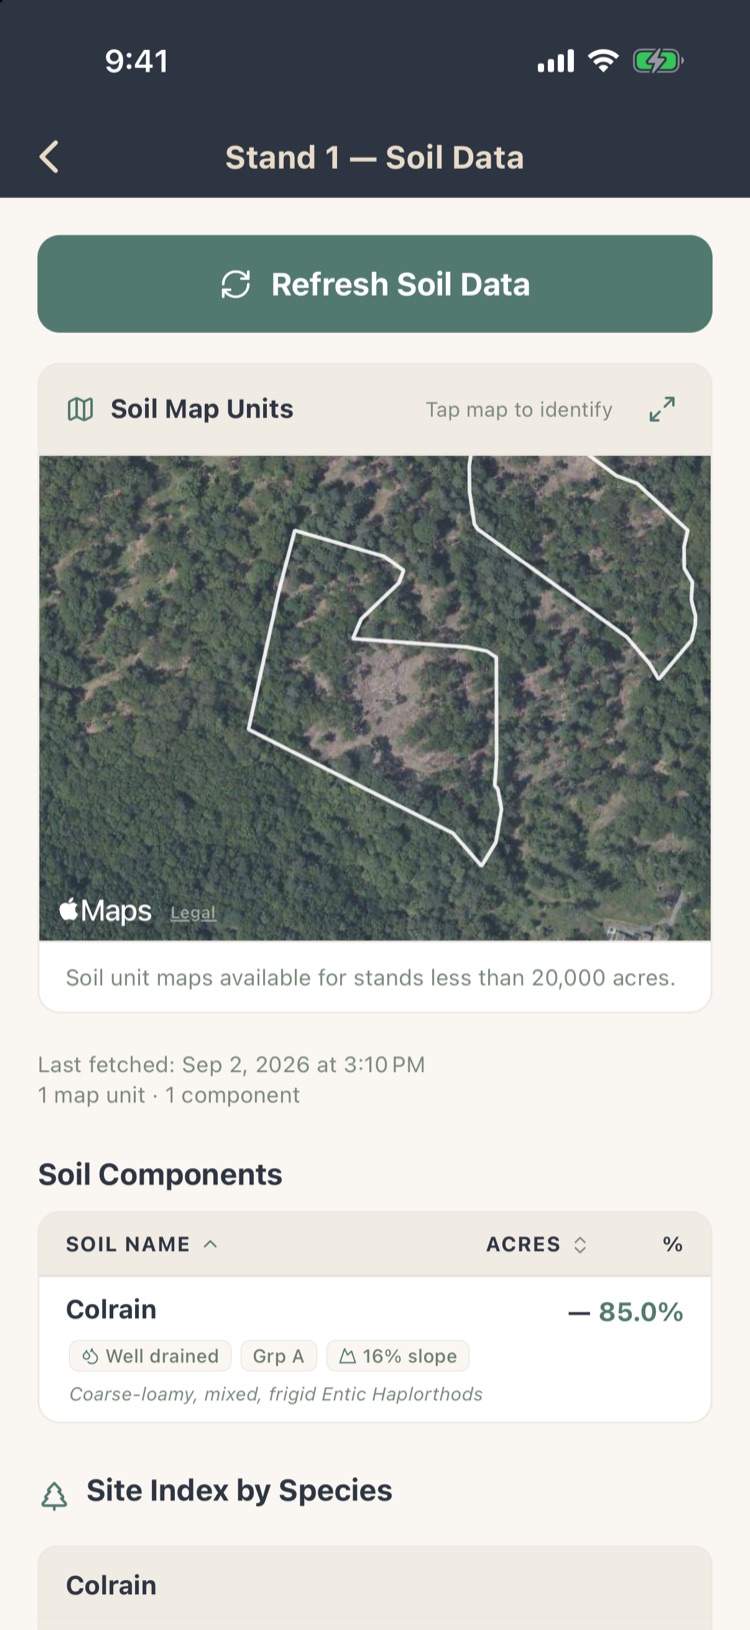
Forest Metrix can download the NRCS soil data for each stand. Tap NRCS Soil Data in a stand’s actions, or Fetch Soils on the Stands screen to do every stand with a boundary at once. A connection is required; it can take a minute.
- Soil Map Units outlines the soil polygons over the stand. Tap the map to identify a unit. Maps are available for stands under 20,000 acres.
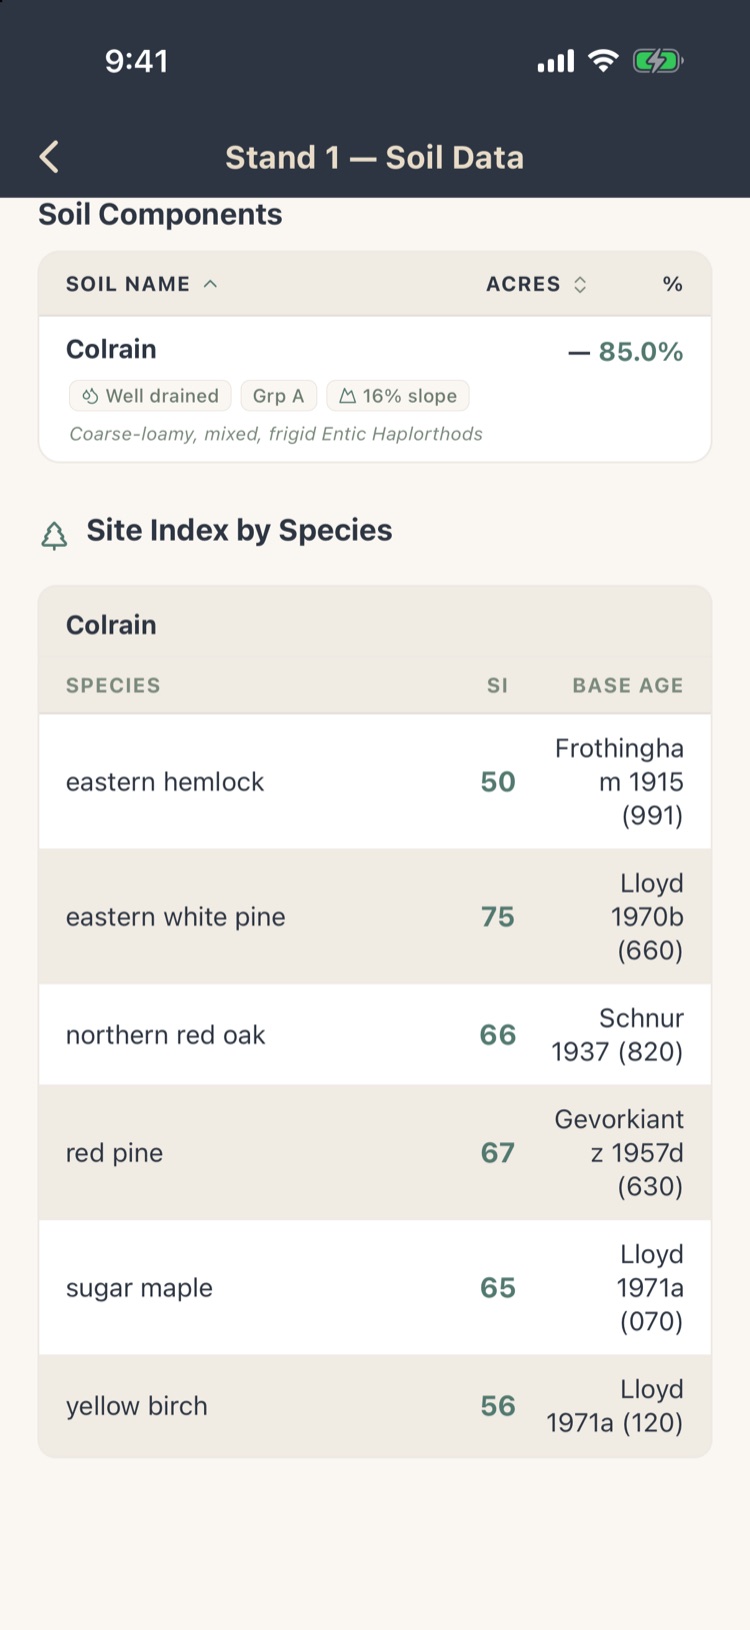
- Soil Components lists each soil series with its drainage, hydrologic group and slope, the acres and the share of the stand.
- Site Index by Species gives the NRCS site index for each species on each soil, with its base age and the curve it comes from.
Soils and site index carry through to the stand reports and the management plan. Refresh Soil Data fetches it again.
Refactor by Soil
Refactor by Soil, below the stand list, replaces your stands with one stand per soil series. The app downloads soils for the whole parcel if it hasn’t yet, then tells you how many stands you have now, how many it will make, and that every plot will be reassigned by location. It warns you if the stands it replaces use different BAFs. Nothing changes until you confirm, and you can undo it straight afterwards.
Refactor by Soil discards the stands you drew. Use it at the start of a project, or on a working copy (Chapter 2) if you want to compare.