Plots
Understand how plots are managed, add plots by hand, understand where plot locations come from, navigate to plots with the map, and bring in plots created elsewhere.
4.1The Plots list
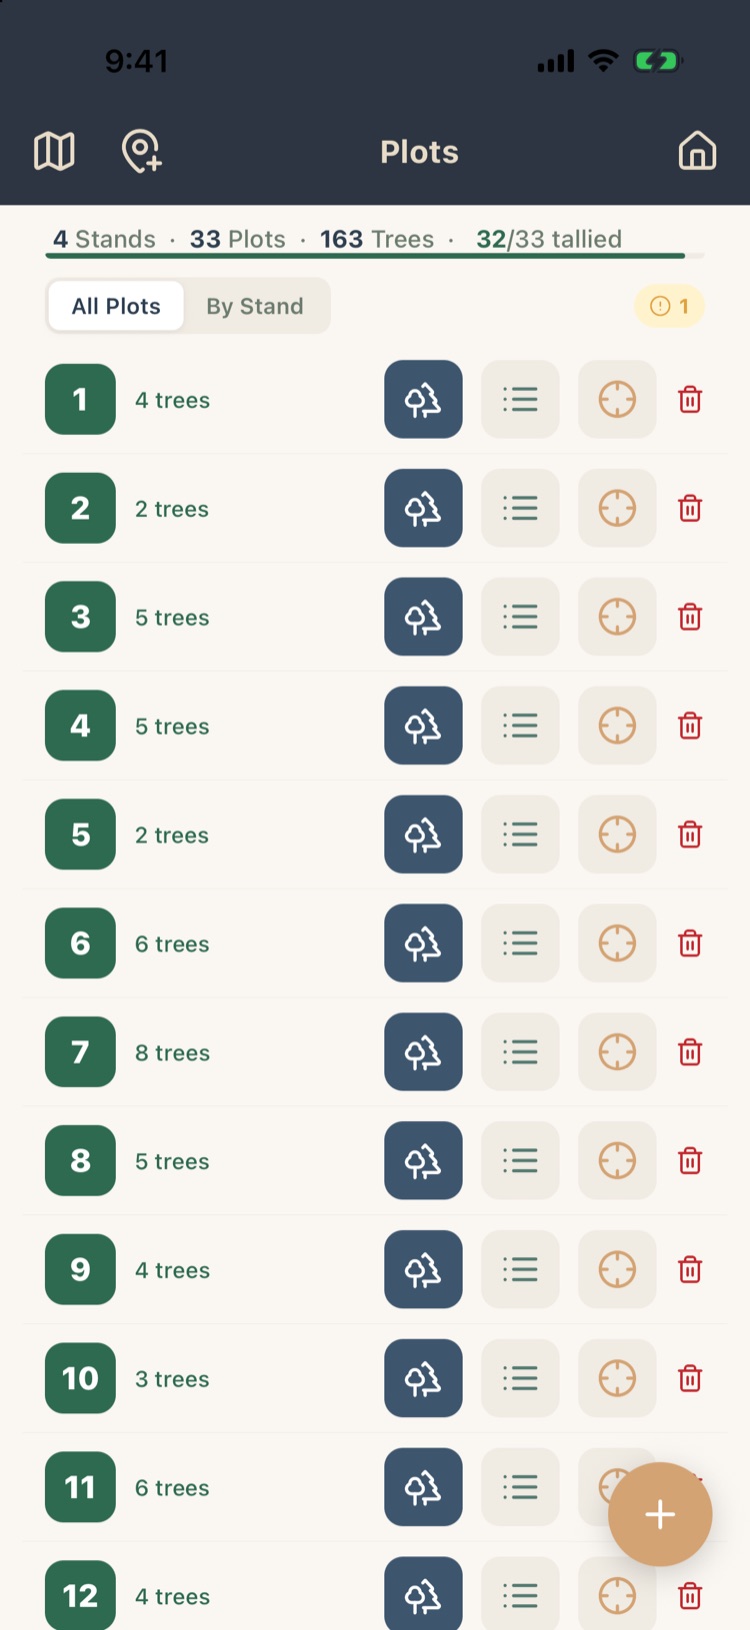
Tap Plots at the top of Project Home. The line at the top totals the project: 4 Stands · 33 Plots · 163 Trees · 32/33 tallied, with a progress bar under it.
- All Plots lists every plot in number order.
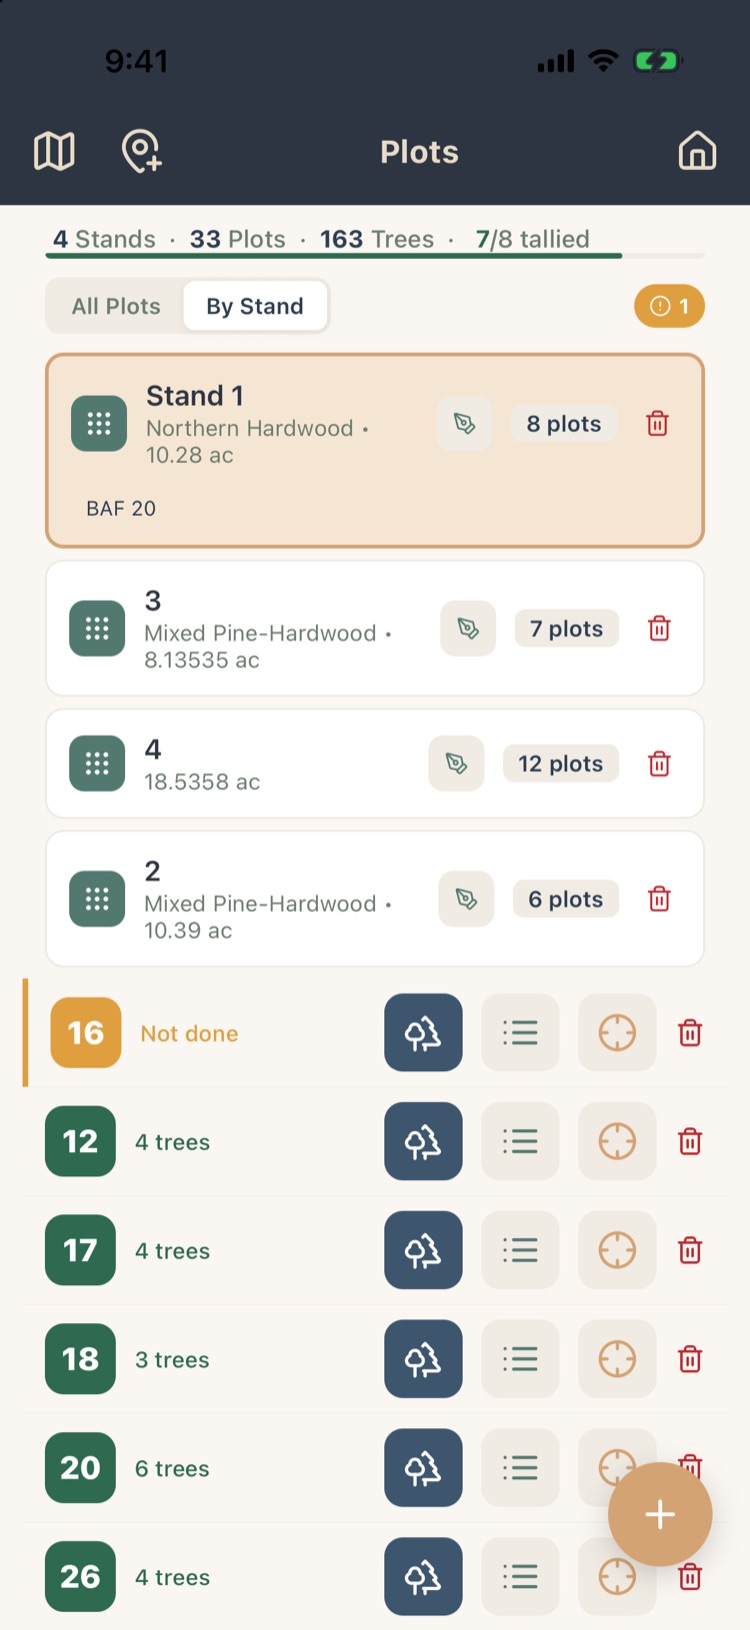
- By Stand shows a card for each stand (forest type, acres, plot count and sampling) and lists the plots of the stand you tap. The pen on a card opens Manage Stands (Chapter 3, section 3.10); the trash deletes the stand.
- The amber chip near the top right shows how many plots aren’t done yet. Tap it to put them at the top of the list; tap it again to go back.
Each plot row has four buttons:
| Button | Opens |
|---|---|
| Tree (dark) | The tally screen on this plot (Chapter 5). |
| Leaf | Pro The plot’s observations: notes, photos, snags, regeneration and the rest (Chapter 6). |
| Target | Pro The map, with directions to this plot (section 4.5). |
| Trash | Deletes the plot (section 4.7). |
Tap + at the bottom right to add a plot. A project with no plots shows Get Started, with buttons to add a stand or a plot.
4.2Plot status
The plot number badge and the line beside it tell you where each plot stands:
| You see | Badge | Meaning |
|---|---|---|
| 4 trees | Green | Trees have been tallied on the plot. |
| Zero tally | Green | The plot was visited and marked done with no trees in it. It counts, as zero, in every per-acre figure. |
| Not done | Amber | Nobody has tallied it yet. |
You mark a plot done, including a zero tally, on the tally screen (Chapter 5). The tallied count at the top of the list and the progress bar count both kinds of finished plot. Plots that are still Not done (no trees, not marked done) are left out of reports rather than counted as empty.
4.3Adding a plot
Most projects get their plots from a grid, a random layout or an import (Chapter 3). Add one by hand when you need an extra plot in the field, or when you cruise without a map.
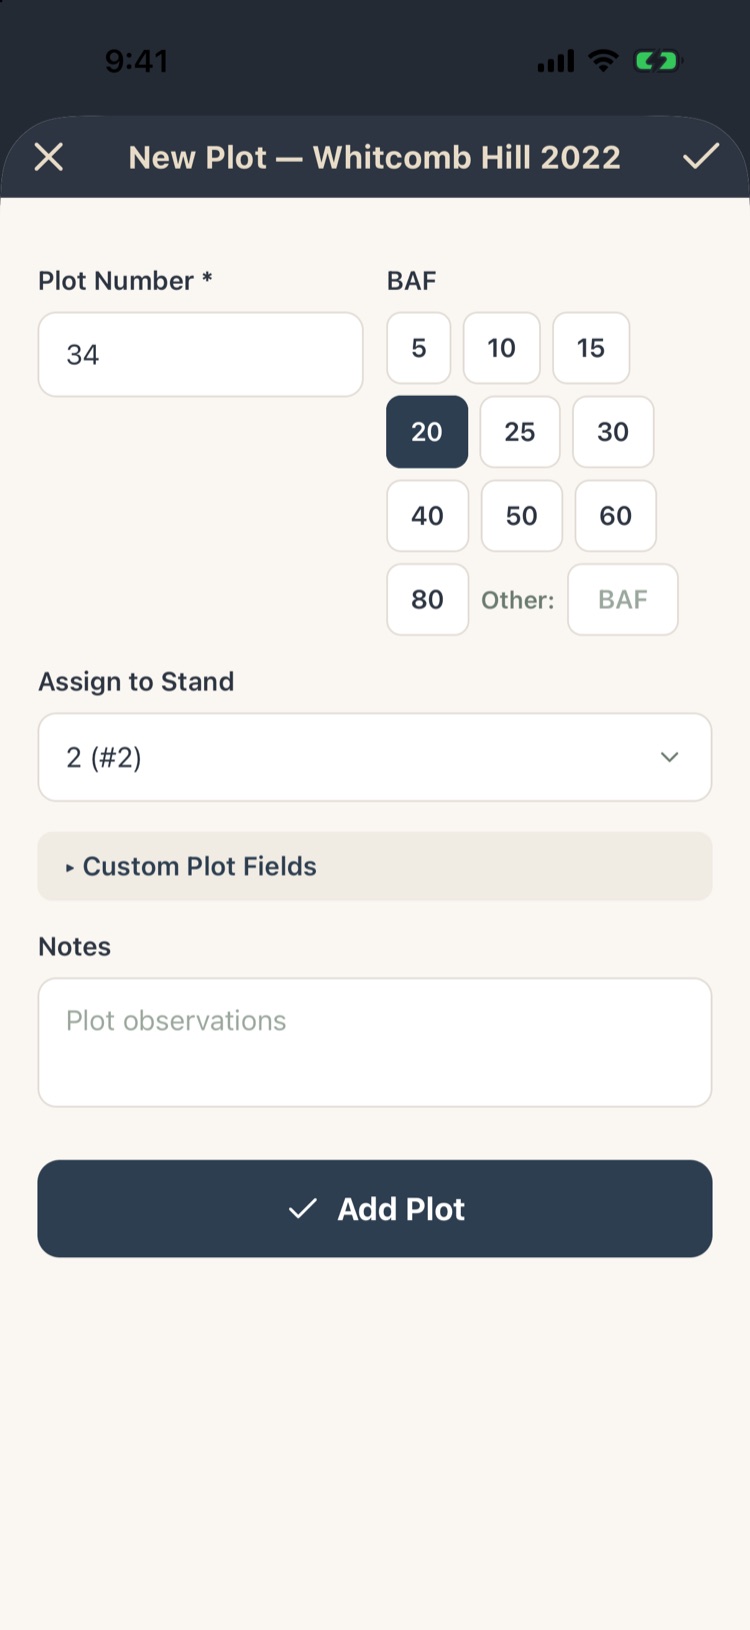
- On the Plots list, tap +.
- Plot Number fills in with the next number after the highest plot in the project. Change it if your field sheet says otherwise; it must be a whole number.
- BAF starts at the project’s (or the stand’s) BAF. Pick another, or type one under Other, for this plot only. The BAF choice only appears for variable-radius sampling; fixed-area and double-sampling plots use the project’s settings. A stand with its own sampling shows a note saying so.
- Assign to Stand starts at the stand you were last working in.
- Open Custom Plot Fields to fill in any plot fields from your template (Chapter 10), and add Notes if you like.
- Tap Add Plot or the check mark.
The new plot has no location yet. It gets one when you tally its first tree (section 4.4).
Count and Measure plots
In a double-sampling project, New Plot starts with Plot Type. A Measure Plot takes full tree data at the measure BAF; a Count Plot takes species and, if you like, DBH at the count BAF. Chapter 5 covers double sampling.
4.4Plot locations
A plot’s location is its plot center. The app uses it to guide you to the plot, to put the plot in the right stand, and to place it on maps and in exports. Locations come from:
- A grid, random layout or Densify (Chapter 3). These are planned locations: where you intend to put the plot center.
- An imported KML file (section 4.6).
- GPS at the first tree. When a plot has no location, the app records your GPS position as soon as you tally its first tree. A short overlay shows while it averages the readings. A plot that already has a location keeps it.
- Dragging on the boundary editor’s map (Chapter 3, section 3.3).
How many readings the app averages into a plot center is set under Settings › GPS › Averaging samples. Each sample adds about a second of standing still. More samples reduce random scatter, but no amount of averaging corrects the bias a heavy canopy causes. Chapter 7 has more on GPS accuracy.
Trees can have their own GPS location too, if your template records it (Chapter 5).
4.5Going to a plot Pro
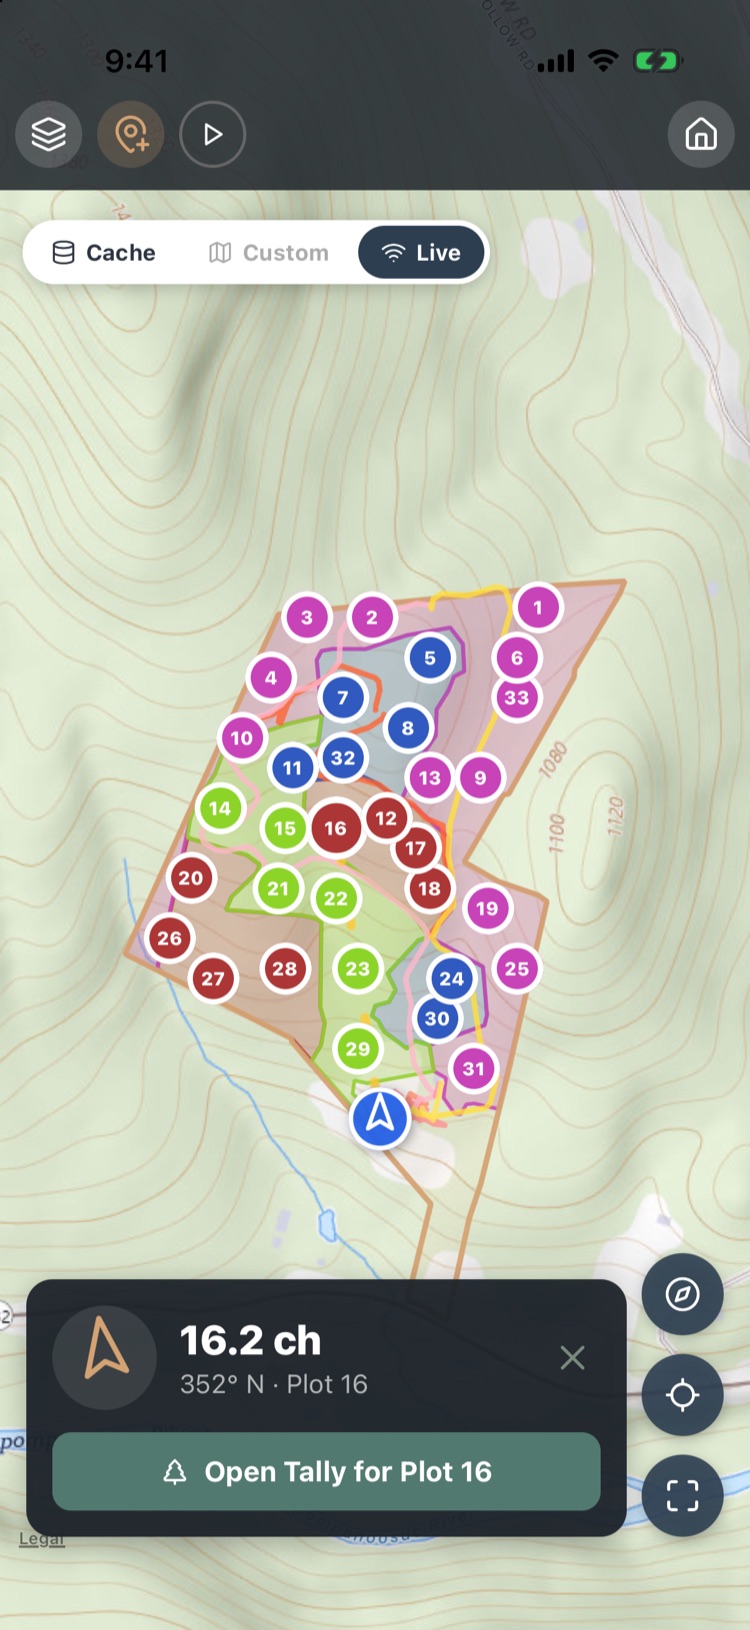
Tap the target button on a plot row. The map opens with your position (the blue arrow) and the plots colored by completion, and a card at the bottom gives:
- Distance to the plot, in chains or feet as set in Settings.
- Bearing from you to the plot, in degrees and as a compass point.
- Open Tally for Plot 16, to start tallying as soon as you arrive.
The distance and bearing update as you walk. Tap × on the card to stop navigating.
You can also navigate from the map itself: tap any plot marker, then Navigate on its card. Chapter 7 covers the map, offline maps and GPS in detail.
4.6Importing plots
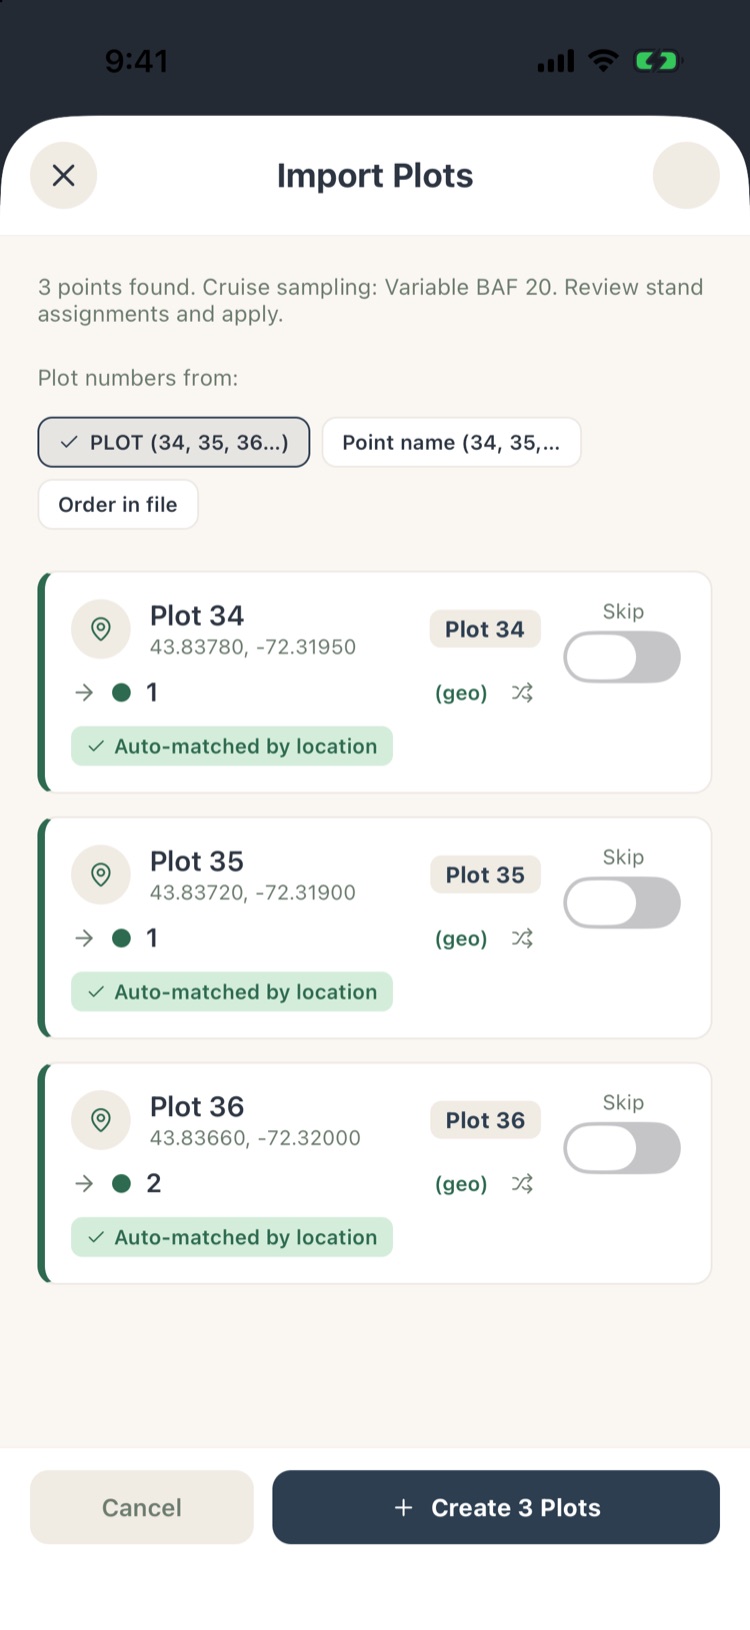
If you planned the plot layout in a GIS, Google Earth or another program, bring it in instead of laying out a new grid. Go to Stands and tap Import Plots, then pick a KML file with one point per plot.
- Plot numbers. The app looks for the plot number in each point’s name and in its attributes, including the attribute table that ArcGIS’s Layer to KML writes. If one field holds a unique whole number on every point, it uses it. If more than one field could be the plot number and they disagree, it asks you to choose at the top of the list.
- Stands. Each point goes into the stand it falls in. If the file has a stand field, it’s used for points outside every stand boundary, but only to match a stand you already have; the import never creates stands. You can change any point’s stand in the list.
- Skip any point you don’t want.
- Tap apply. Points whose plot numbers already exist in the project are skipped, and the app tells you how many plots it added and how many it skipped.
Imported plots take the project’s BAF. To import stand boundaries, see Chapter 3, section 3.8.
4.7Deleting plots
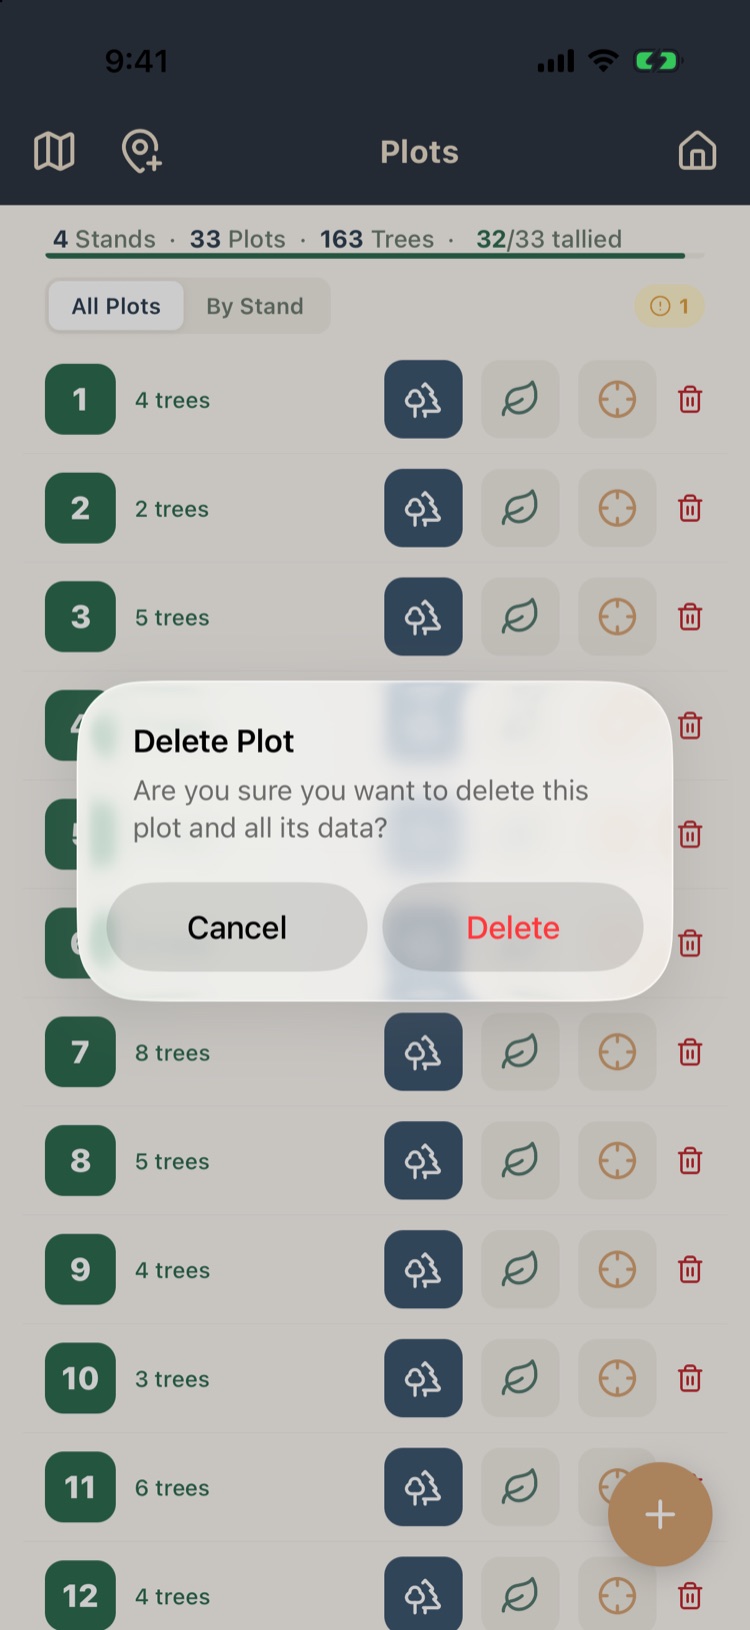
Tap the trash on a plot row and confirm Delete. The plot goes, and so does everything recorded on it: trees, observations, photos, snags, regeneration and the rest.
A deleted plot is deleted on every device once it syncs. If you might want it back, make a working copy of the project first (Chapter 2, section 2.4).
Other ways plots are removed:
- Deleting a stand keeps its plots. They become unassigned (Chapter 3, section 3.10).
- Unassigned plots can be deleted together with Delete These at the bottom of the Stands screen.
- Creating a grid on a project that already has plots replaces all of them (Chapter 3, section 3.4).
Numbers aren’t closed up after a delete: deleting plot 12 leaves a gap. New plots continue from the highest number left.