Reports and statistics
Evaluate the data: volume and value by product and species, stocking and stand density, sampling statistics, and ecological reports. Every report can be customized, printed, shared or exported.
8.1The Reports screen
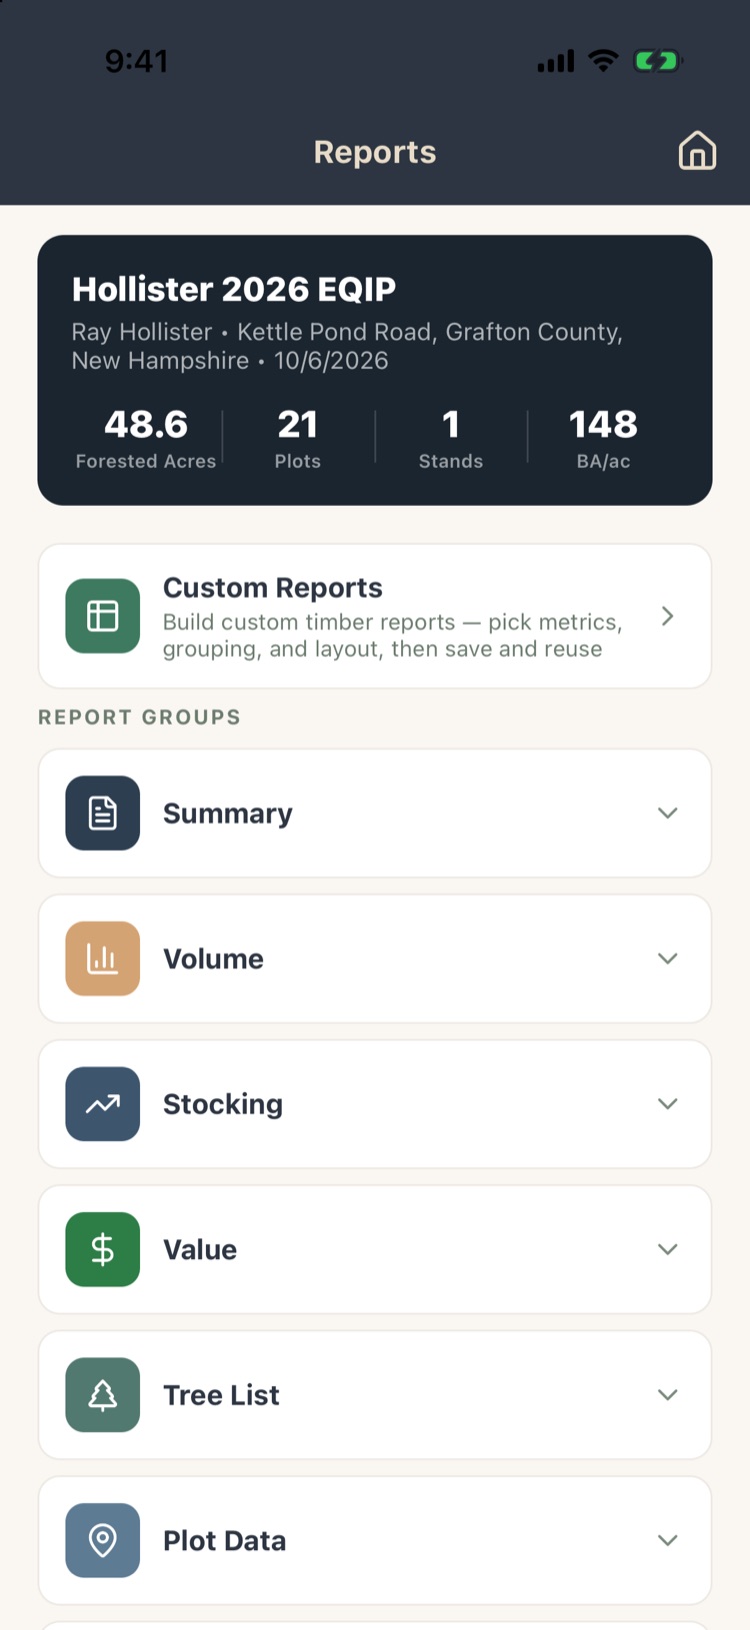
Tap Reports at the top of Project Home. The card at the top sums up the project: forested acres, plots, stands and basal area per acre.
- Favorites: tap the ♡ beside any report to pin it to the top.
- Custom Reports Pro: build your own tables (section 8.10).
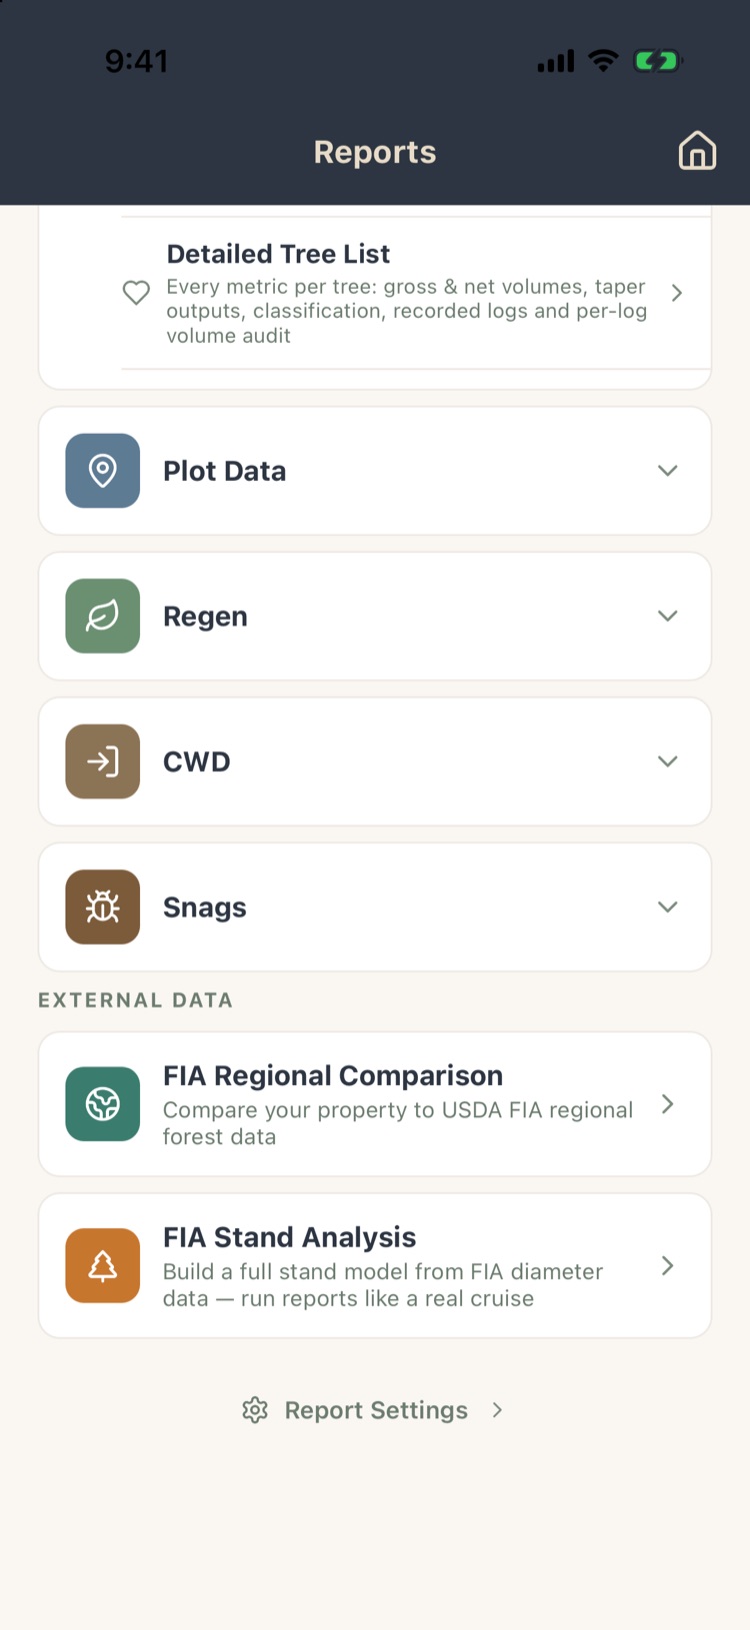
- Report groups: Summary, Volume, Stocking, Value, Tree List, Plot Data, Regen, CWM and Snags. Tap a group to open it, then tap a report. Regen, CWM and Snags appear only when you collect that data.
- External Data Pro: comparisons with USDA Forest Service FIA data (section 8.11).
- Report Settings at the bottom (section 8.12).
Reports are worked out on the phone from the data on it, so they work offline and update the moment you change a tree.
Every report can also be previewed in the web app at app.forestmetrix.com, on a bigger screen.
A banner at the top of a report warns you about anything that changes the numbers: products without a volume rule, plots outside every stand, a 100% tally stand with no acres, or a species without taper coefficients. Most banners open the screen where you can fix the cause.
8.2Tract or stand, and weighting
Most reports start with the same controls:
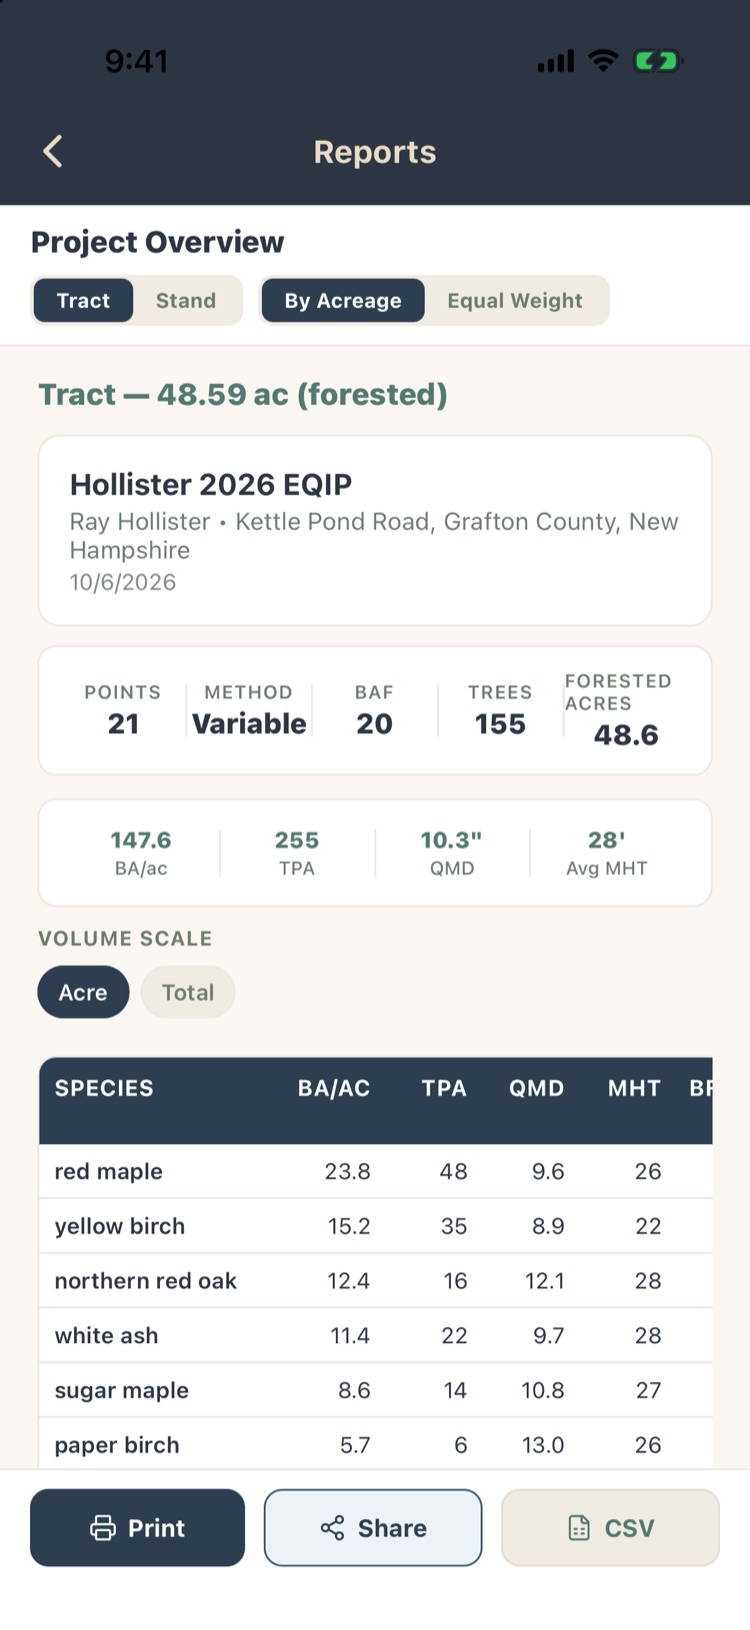
- Tract reports the whole property; Stand lets you pick one stand from a row of chips.
- By Acreage weights each stand by its acreage when combining them into tract figures, the usual choice. Equal Weight averages every plot equally regardless of stand.
- Products shown chips turn products on and off in the report.
- Scale or Volume scale: Acre for per-acre figures, Total for the whole tract or stand.
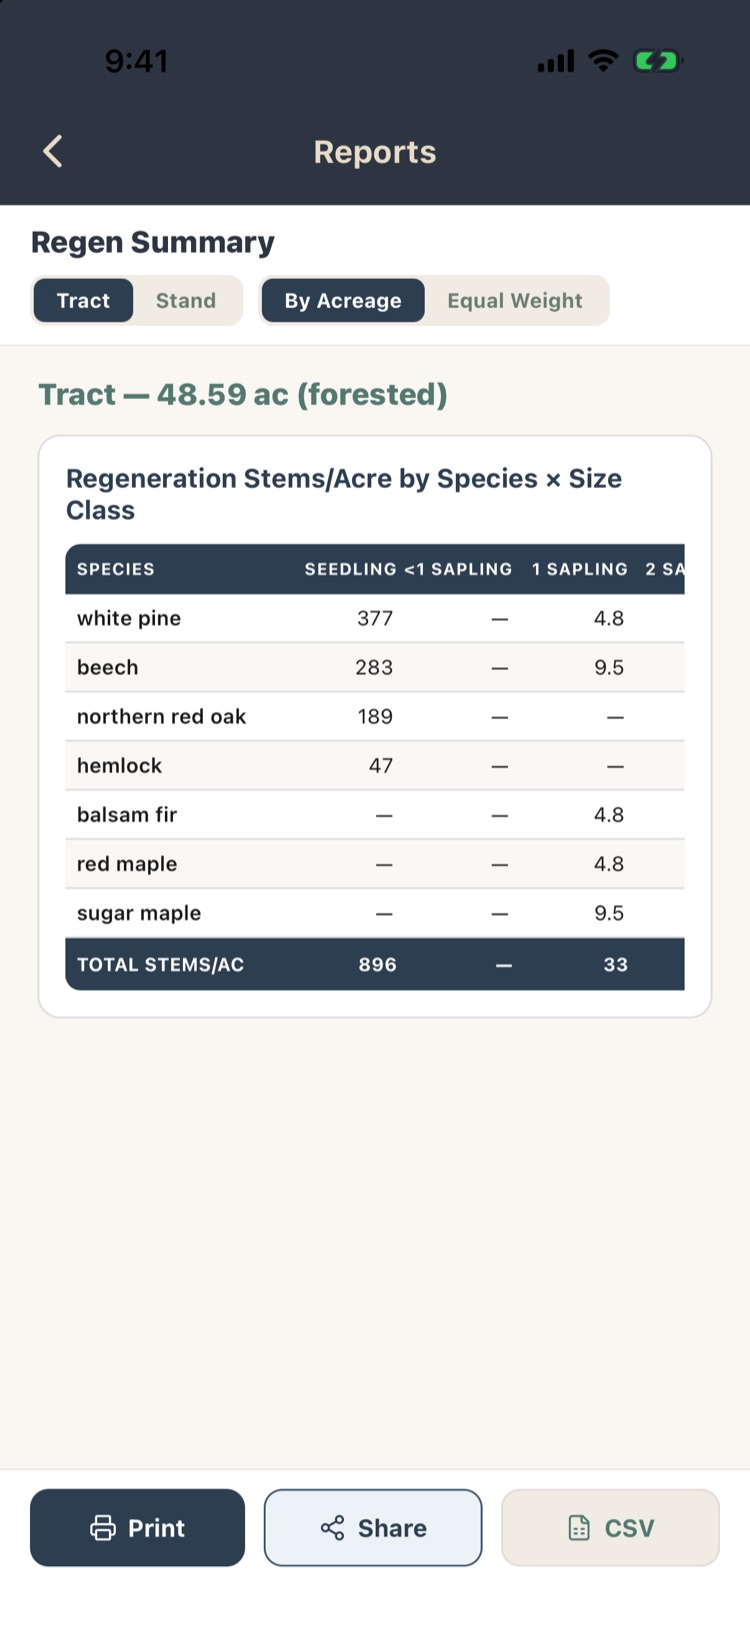
The line under the controls confirms what you’re looking at, for example Tract — 48.59 ac (forested). Non-forested stands are left out of the acreage (Chapter 3, section 3.9).
8.3Summary reports
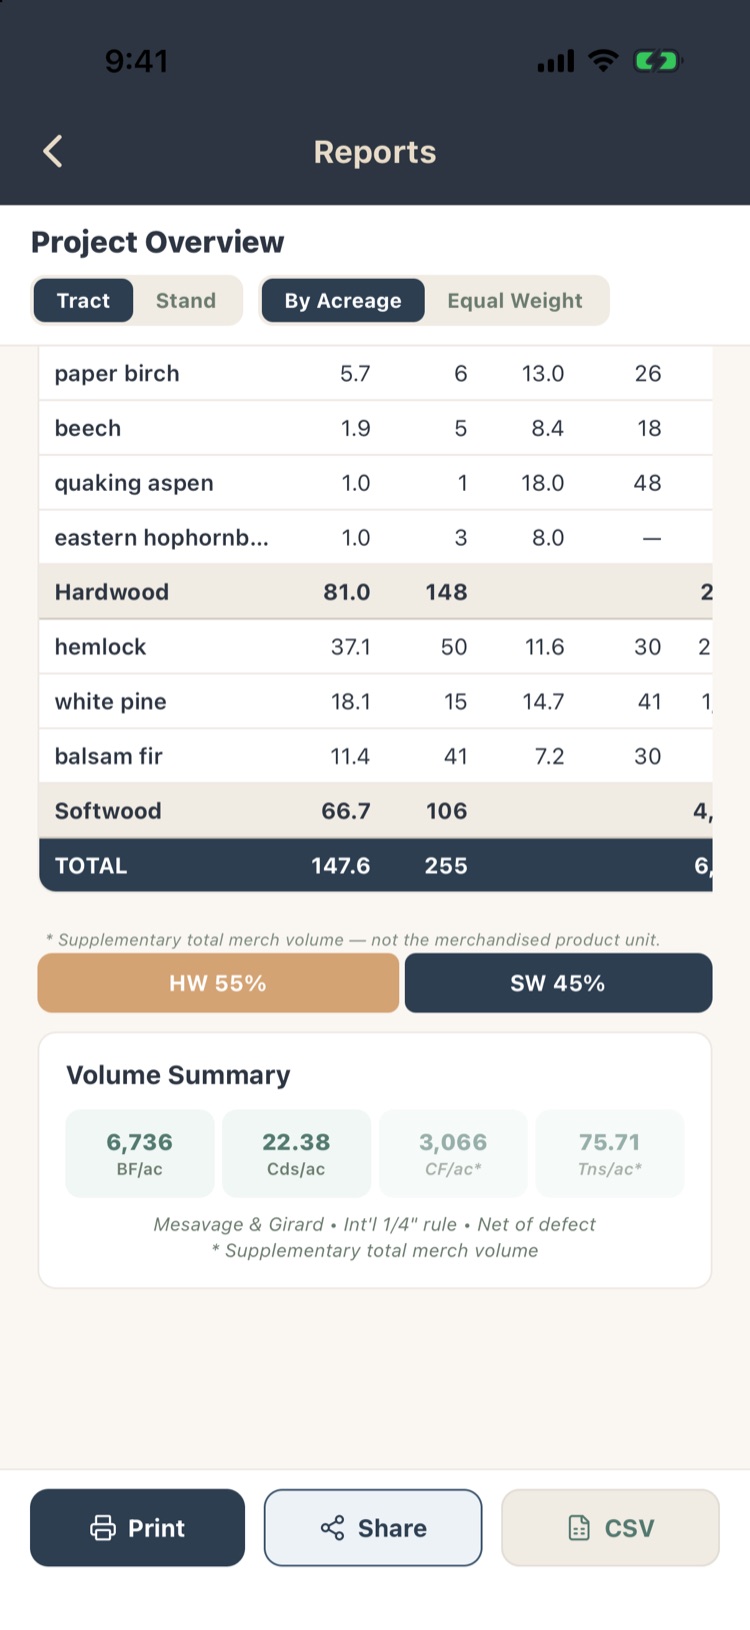
- Project Overview: the project’s details; plot count, method, BAF, trees and forested acres; basal area, trees per acre, QMD and average merchantable height; a species table with hardwood and softwood subtotals; and the Volume Summary per acre in board feet, cords, cubic feet and tons.
- Summary Charts: basal area, trees per acre and volume as charts.
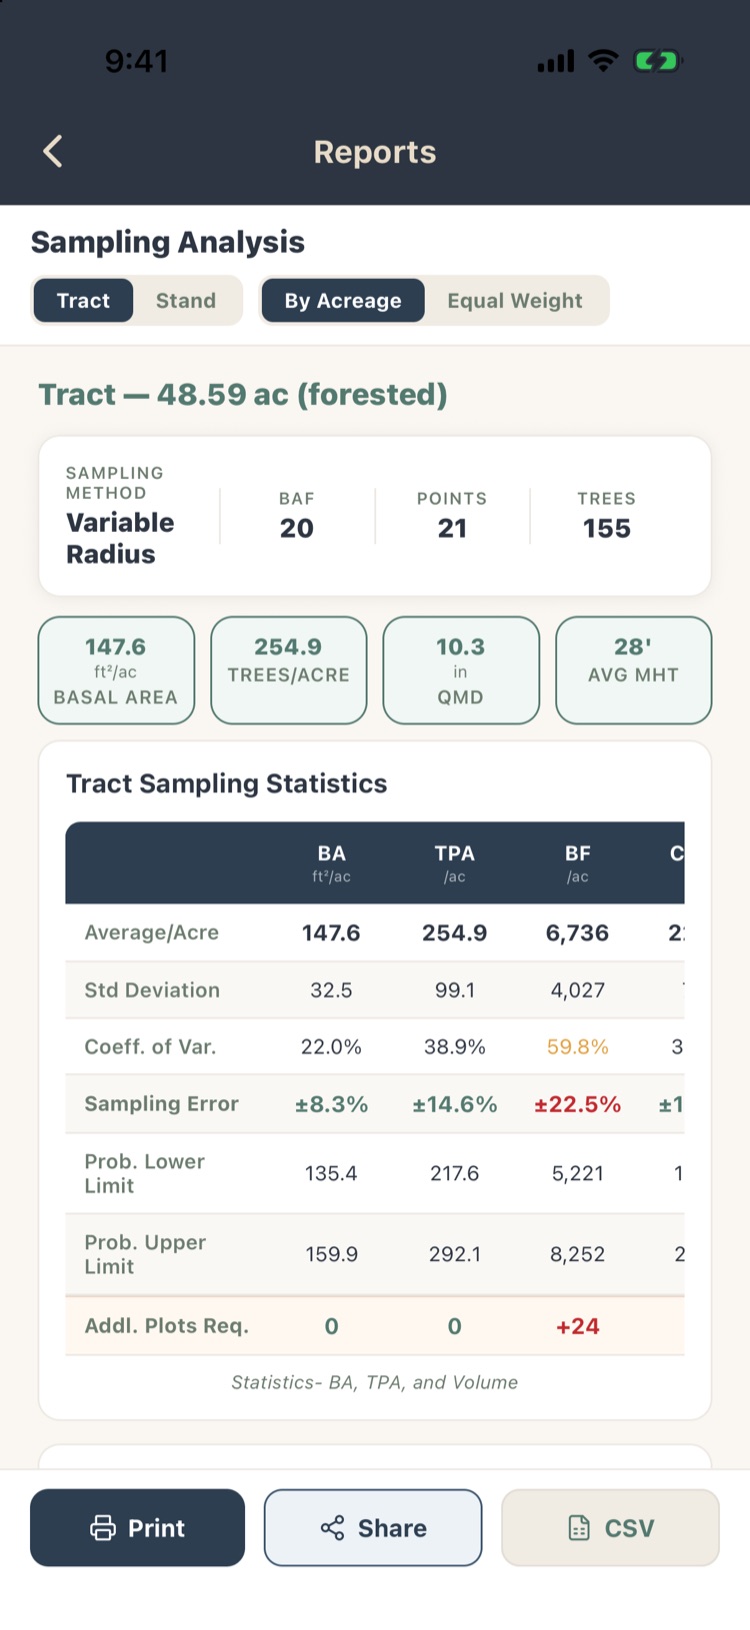
- Sampling Analysis: for basal area, trees per acre and volume: the mean, standard deviation, coefficient of variation, sampling error, confidence limits, and how many more plots you’d need to reach your sampling-error goal.
The confidence level (68%, 80%, 90%, 95% or 99%) and the sampling-error goal are set under Settings › Other (Chapter 11). Sampling error uses Student’s t for your number of plots.
8.4Volume reports
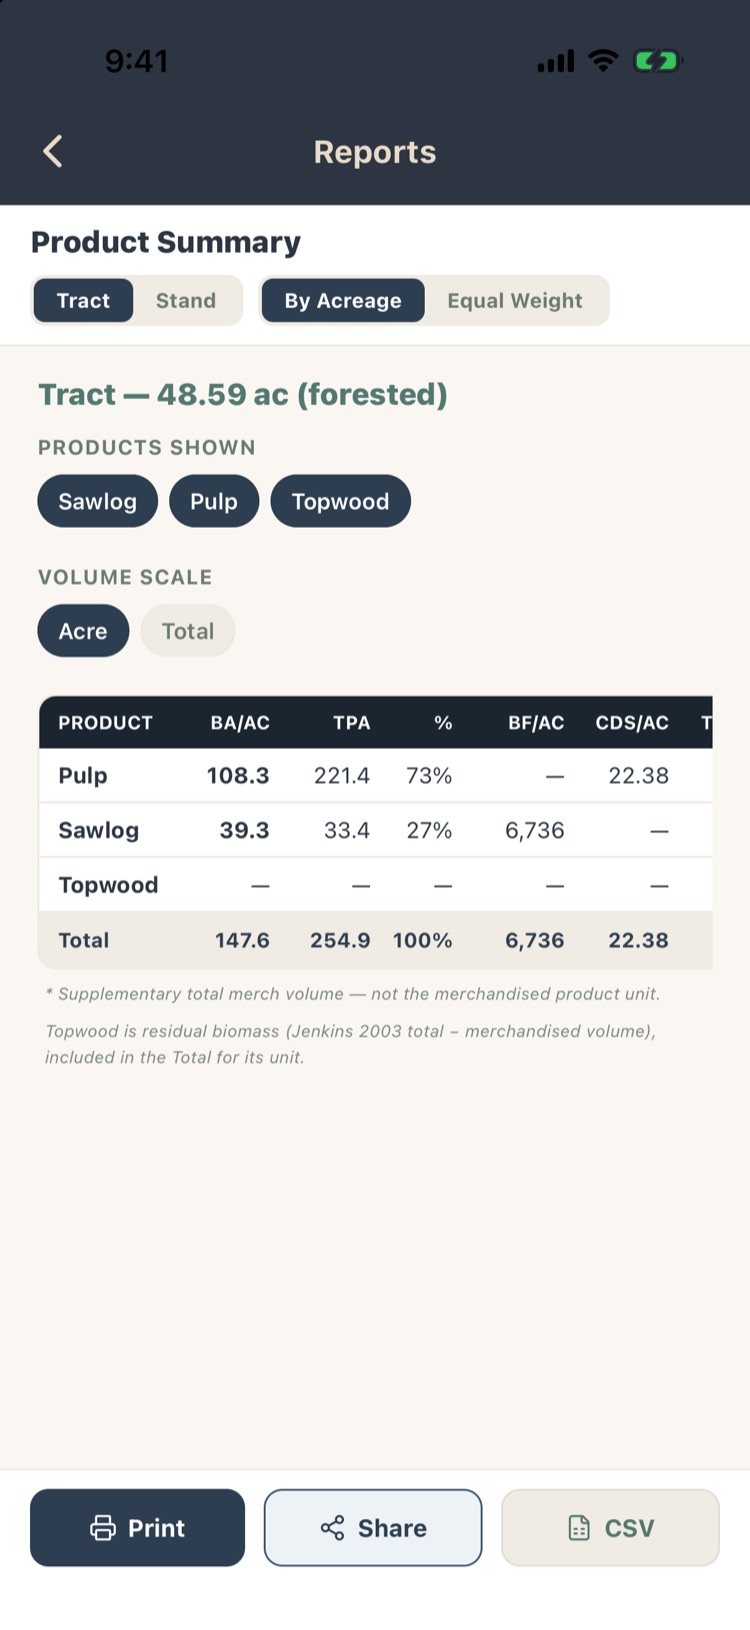
- Product Summary: basal area, trees per acre and volume for each product.
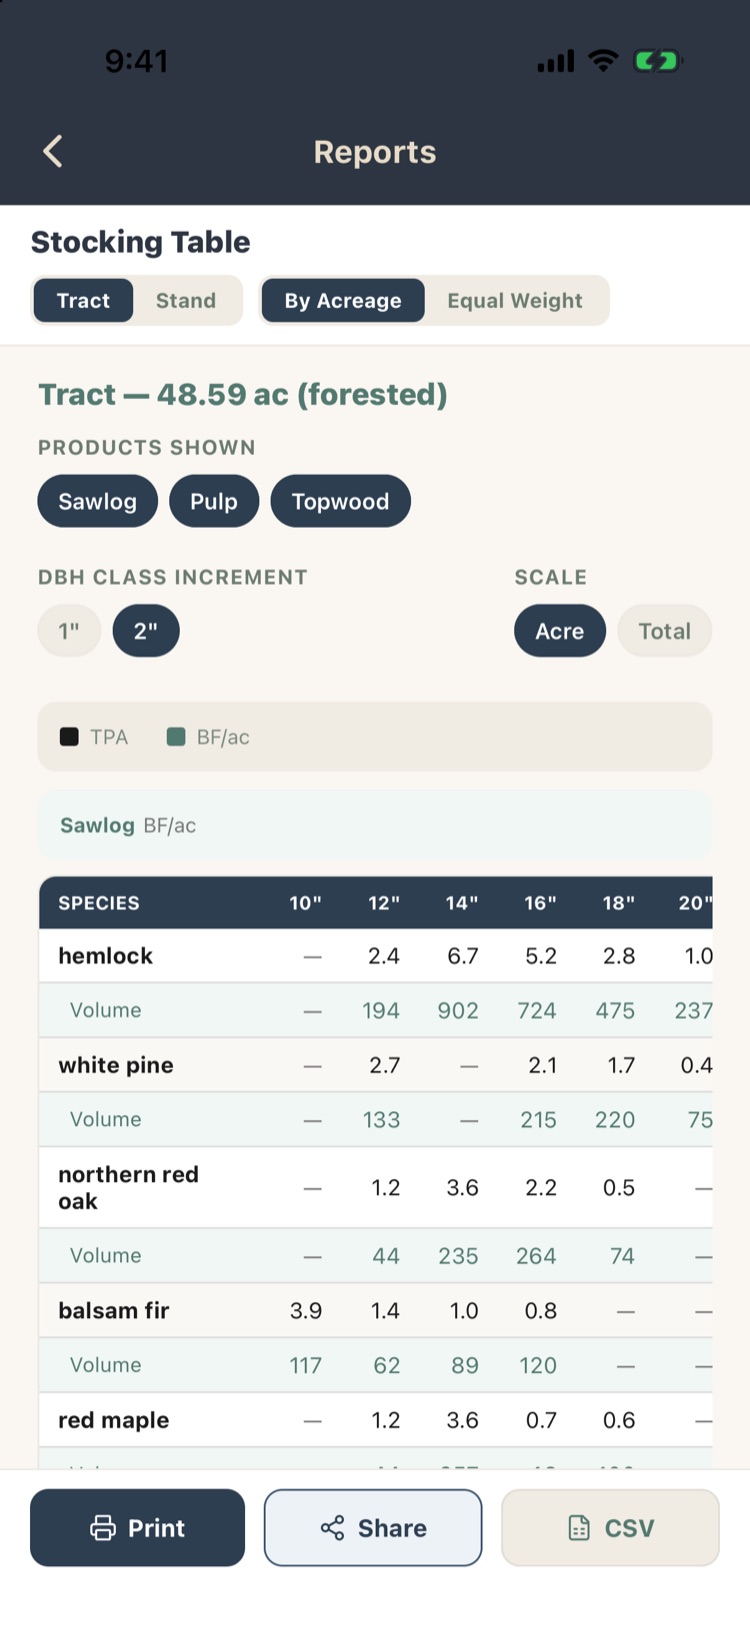
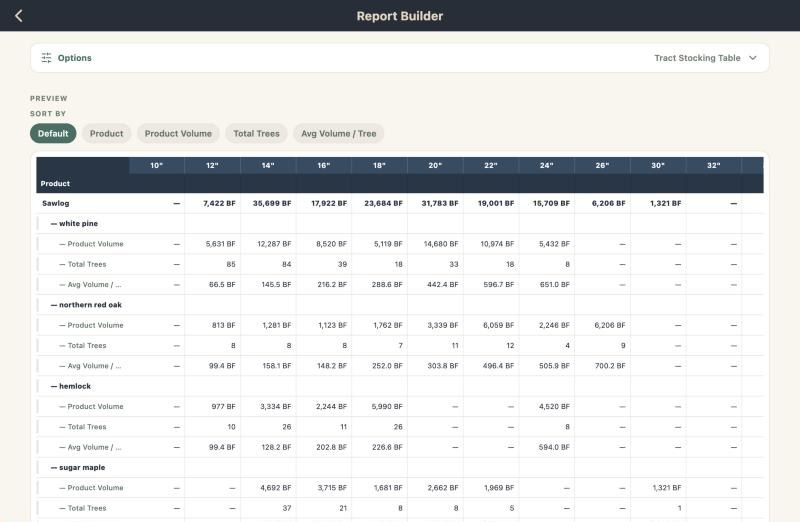
- Stocking Table: trees per acre and volume by species and DBH class, with the product breakdown. Choose 1" or 2" classes.
- Stocking Table (Dynamic) and Products by Species (Dynamic): the same ideas, laid out the way you choose.
- Biomass and Carbon: whole-tree green tons by species (Jenkins 2003), split into roots, bole and branches/foliage.
- Contribution Trace: a diagnostic showing how every tree’s volume becomes the per-acre total.
Volume comes from each product’s volume rule and the project’s taper model, set under Settings › Products (Chapter 10). Topwood is the wood above your products, from biomass equations.
8.5Stocking reports
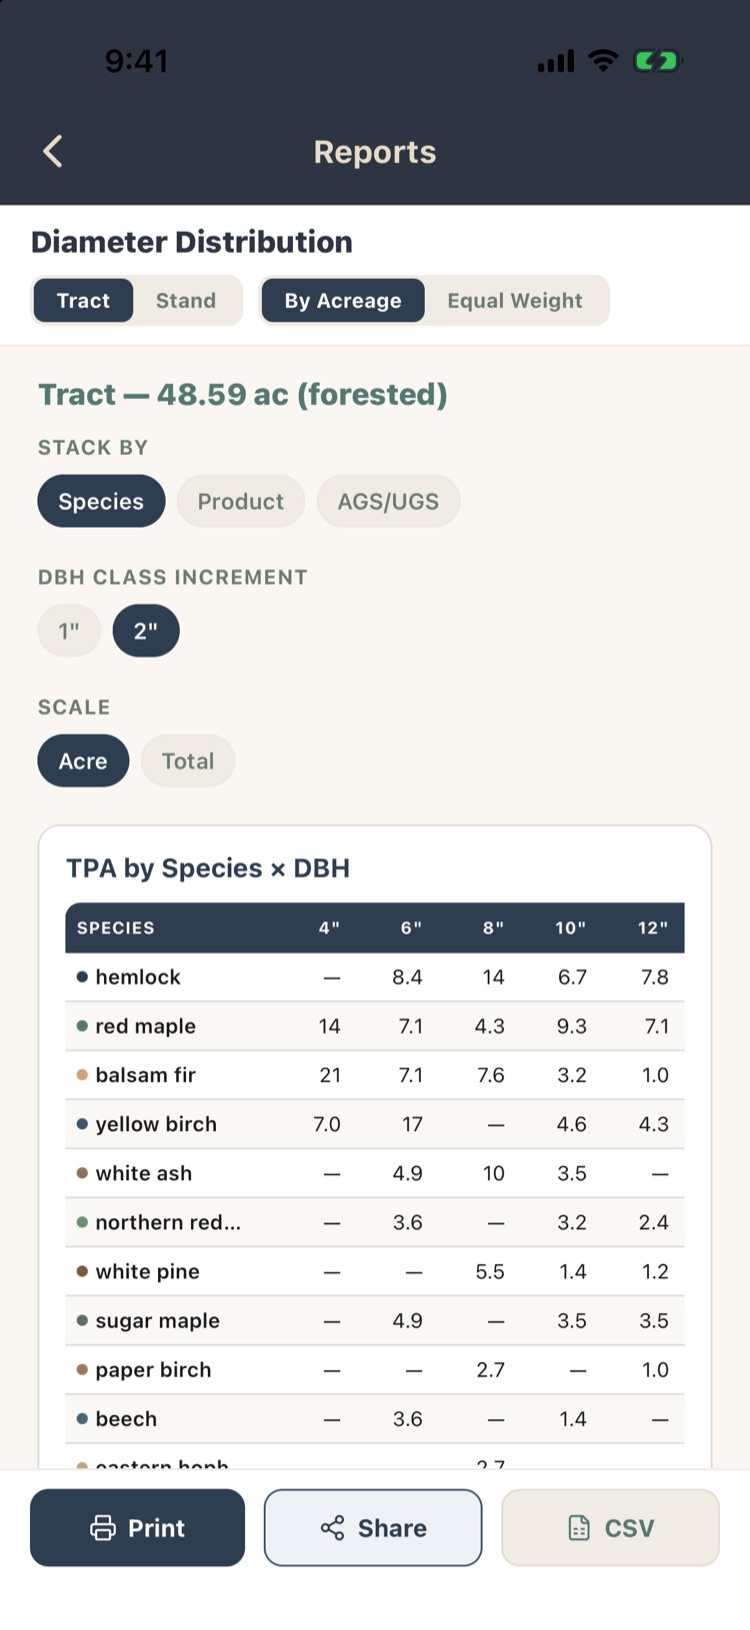
- Diameter Distribution: trees per acre by species and DBH class. Stack by species, product, or a custom tree field such as AGS/UGS.
- Stocking Graph: a stacked bar chart lined up over the DBH table.
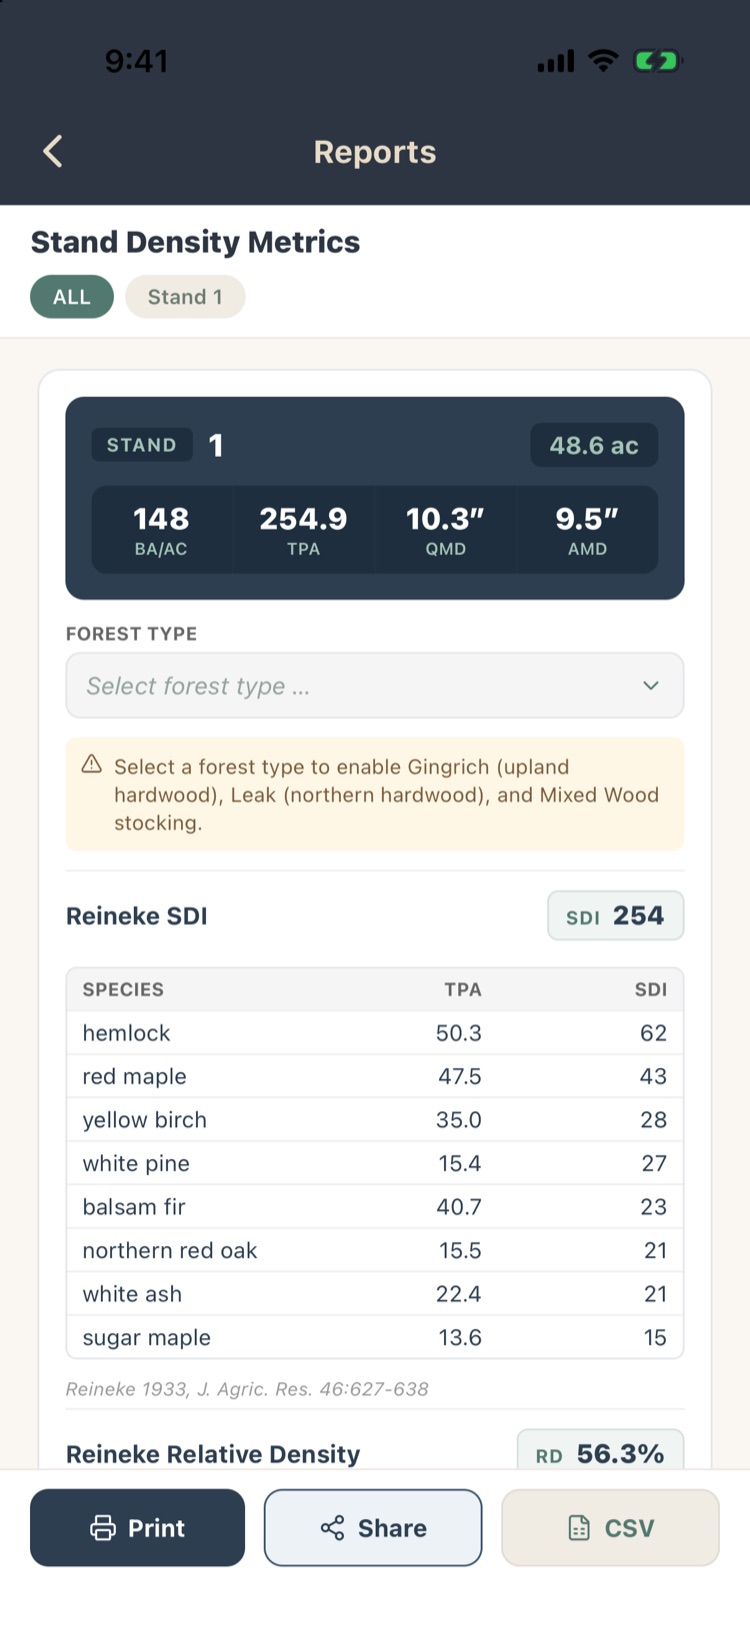
- Stand Density Metrics: for each stand, Reineke’s stand density index, relative density, and stocking percent on the Gingrich (upland hardwoods and oaks) or Leak (northern hardwood) guide. Choose the stand’s forest type to switch on the stocking guide. The AMD shown is the arithmetic mean diameter, using the DBH cutoff you choose.
- Stand Table by Size Class: trees per acre by size class.
- Per-Plot BA Values: each plot’s basal area, with a distribution chart.
- Q-factor curves Pro: compare the diameter distribution with a target q for uneven-aged management.
8.6Value reports
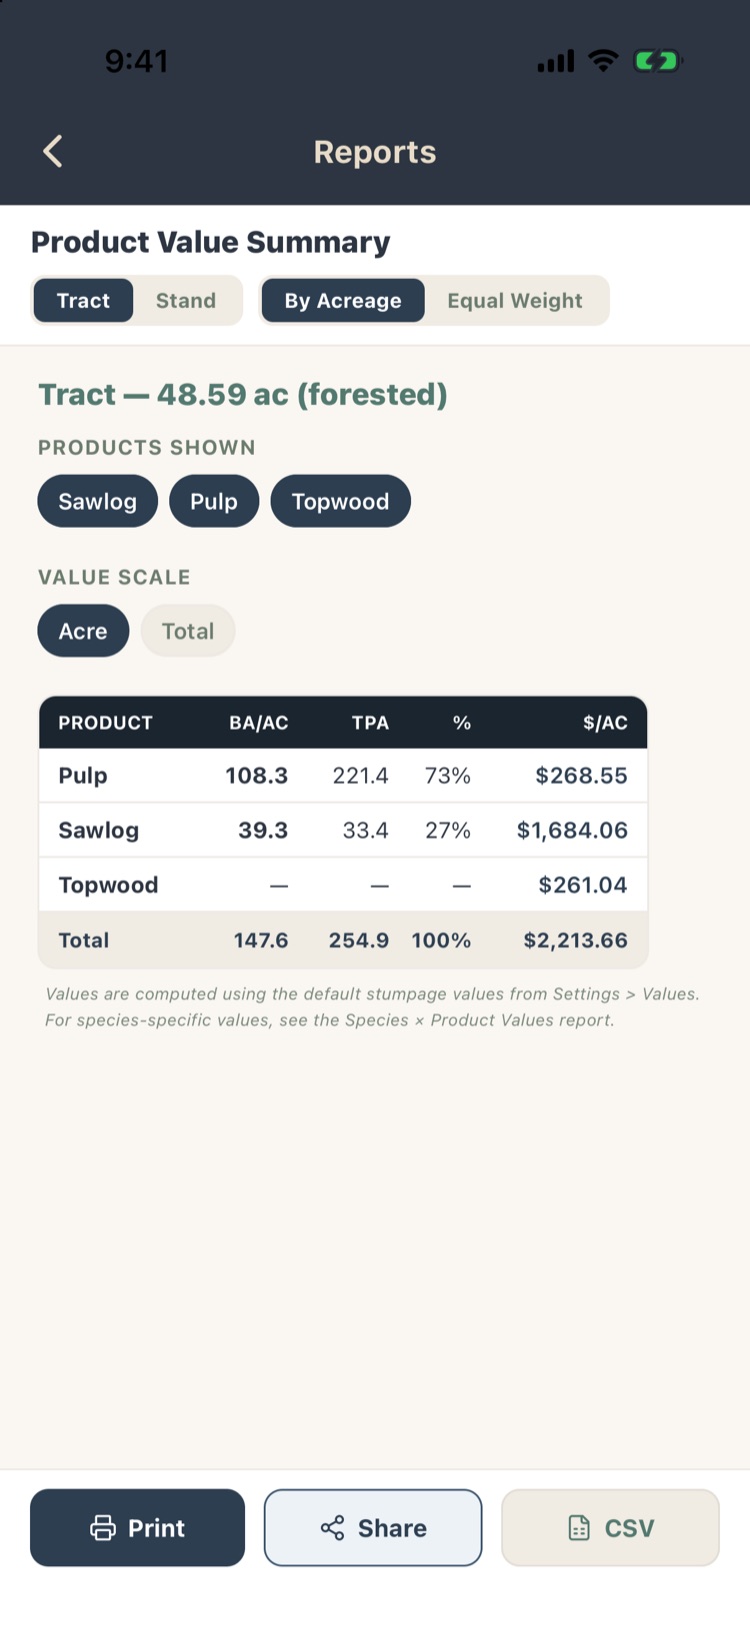
- Product Value Summary: dollar value per acre (or in total) by product.
- Species × Product Values: value for each species and product, with row and column totals.
- Species Product Value (Dynamic).
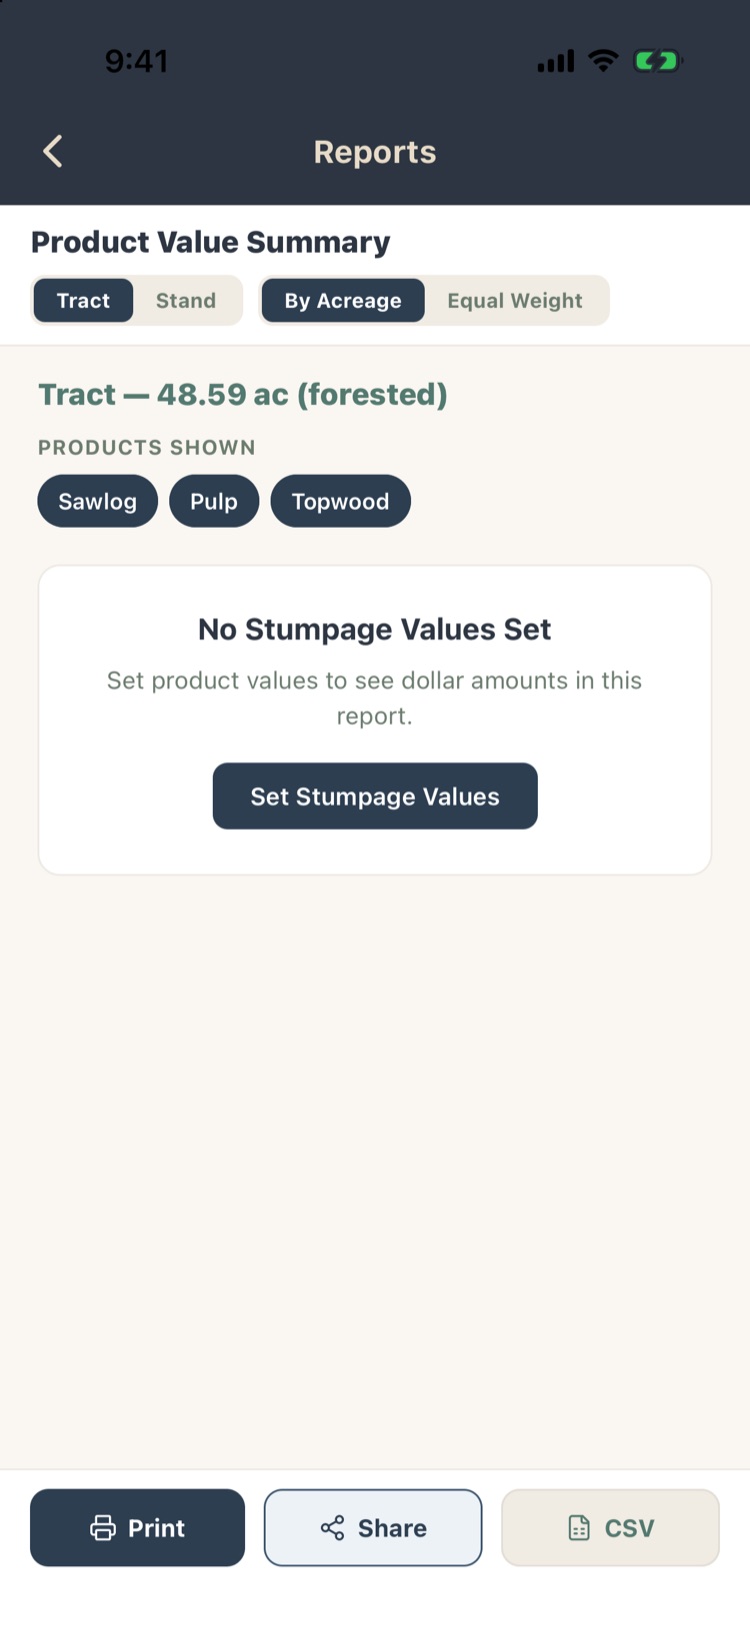
Values come from your stumpage prices under Settings › Values: a default price per product, and optional prices per species (Chapter 10). Until you enter prices, the value reports say No Stumpage Values Set with a button to set them.
8.7Tree lists and plot data
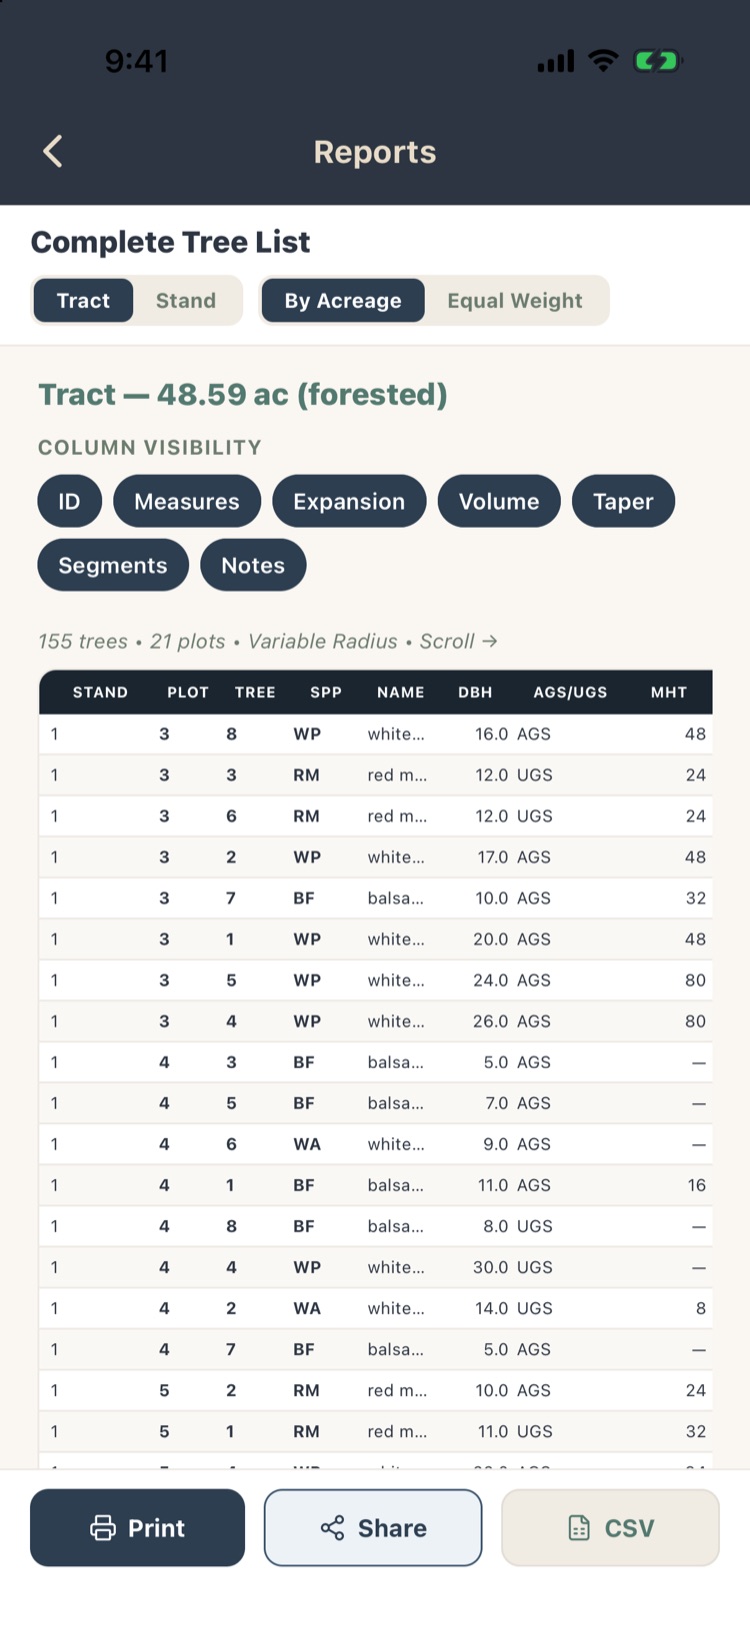
- Complete Tree List: every tree with its stand, plot, tree number, species, DBH, fields, height, product, defect and volumes. Column visibility chips (ID, Measures, Expansion, Volume, Taper, Segments, Notes) choose what’s shown. Scroll sideways for more columns.
- Detailed Tree List: every number for every tree: gross and net volumes, taper results, classification, and each log’s volume, for checking the math.
- Plot Observations: per plot: timber figures, notes, ecological observations, coordinates and counts.
- Custom Plot Data and Custom Plot Data Summary: your plot fields, checklists and tables, plot by plot and summarized (Chapter 6).
8.8Regeneration, CWM and snags
- Regen Summary: seedlings and saplings per acre by species and size class, using each class’s plot size.
- CWM Summary and CWM by Species: pieces and volume of down wood, by species and decay class.
- Snag Summary and Snags by Species: snags per acre, average DBH and decay classes.
These groups appear only when the data is turned on under Plot Optional Data (Chapter 6, section 6.9).
8.9Printing and sharing reports
Every report has three buttons at the bottom:
- Print: print it, or save it as a PDF from the print screen. The PDF carries your report style, logo and footer (section 8.12).
- Share: send the report as a web page by email, Messages, AirDrop or any app.
- CSV: the report’s table as a spreadsheet file.
The printed, shared and spreadsheet versions show the same numbers as the screen. Whole-project exports (an Excel workbook of all the data, map files and photos) are in Chapter 9.
8.10Custom reports Pro
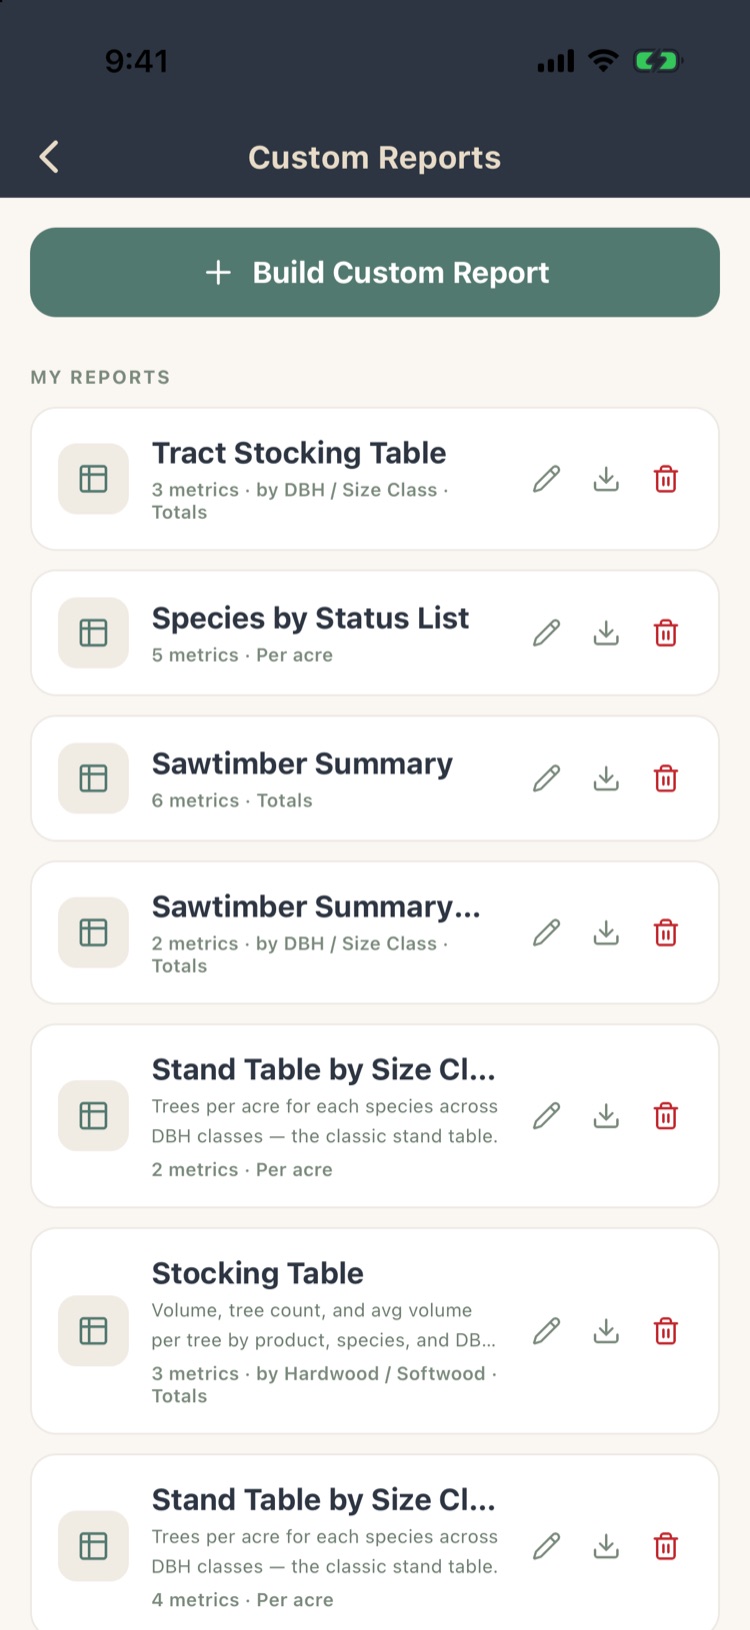
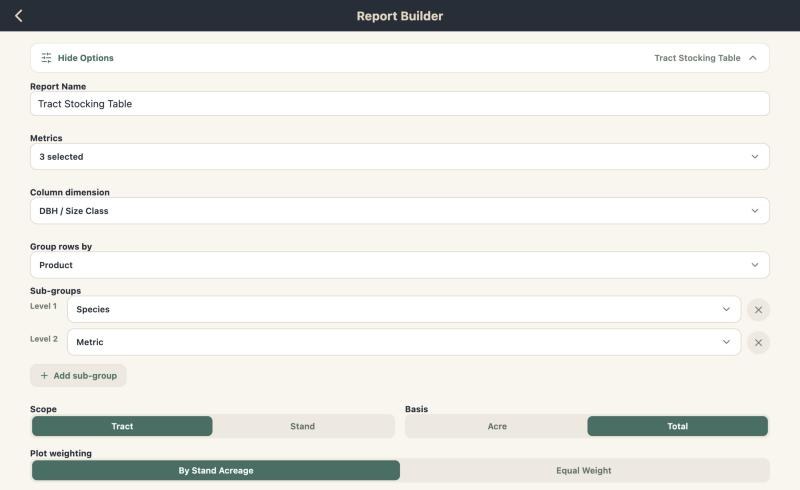
When none of the standard reports are laid out the way you need, build your own. Tap Custom Reports. This is much easier on the web, where you have a larger screen and can see changes happen on the reports immediately when you adjust options.
- My Reports lists your saved reports. Tap one to open it, ✎ to edit, ⬇ to export, or the trash to delete. Starter Reports are ready-made ones to copy. Import Report brings in one someone shared with you.
- Tap + Build Custom Report to start a new one.
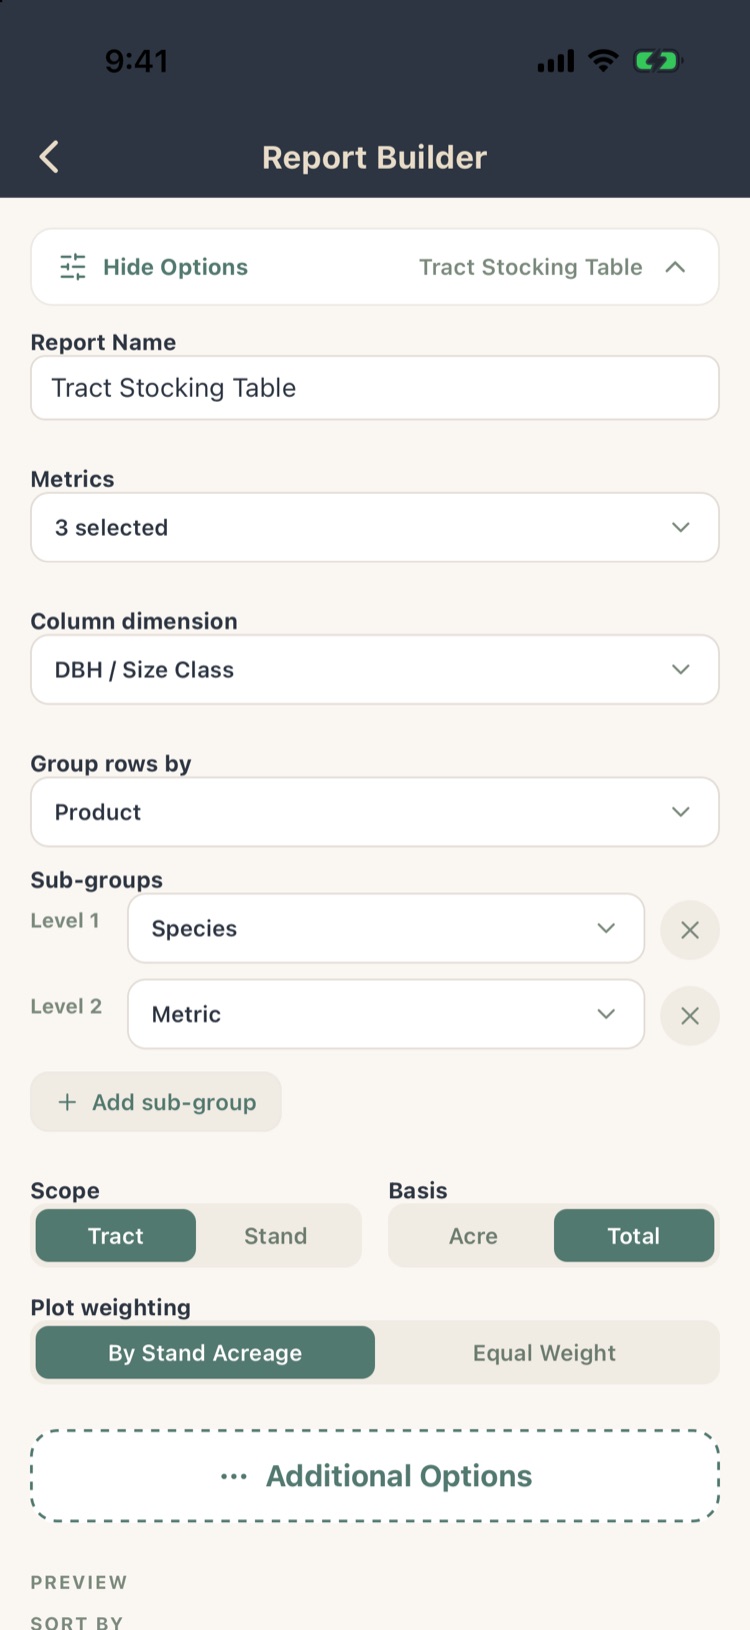
In the builder, tap Options to set:
- Report Name and Metrics: what goes in the cells, such as volume, trees, basal area or average volume. Pick several, and reorder them.
- Column dimension: what goes across, such as DBH class, product or species.
- Group rows by, with up to two levels of Sub-groups.
- Scope (tract or stand), Basis (per acre or total) and Plot weighting.
- Additional Options: volume unit; DBH classes by 1" or 2" steps or your own groups (for example pole, small saw, large saw); and filters by DBH range, hardwood or softwood, and product.
The preview updates as you go; sort it by any column. Save, then print, export or share it like any other report. Custom reports are kept with your account and appear in the web app too.
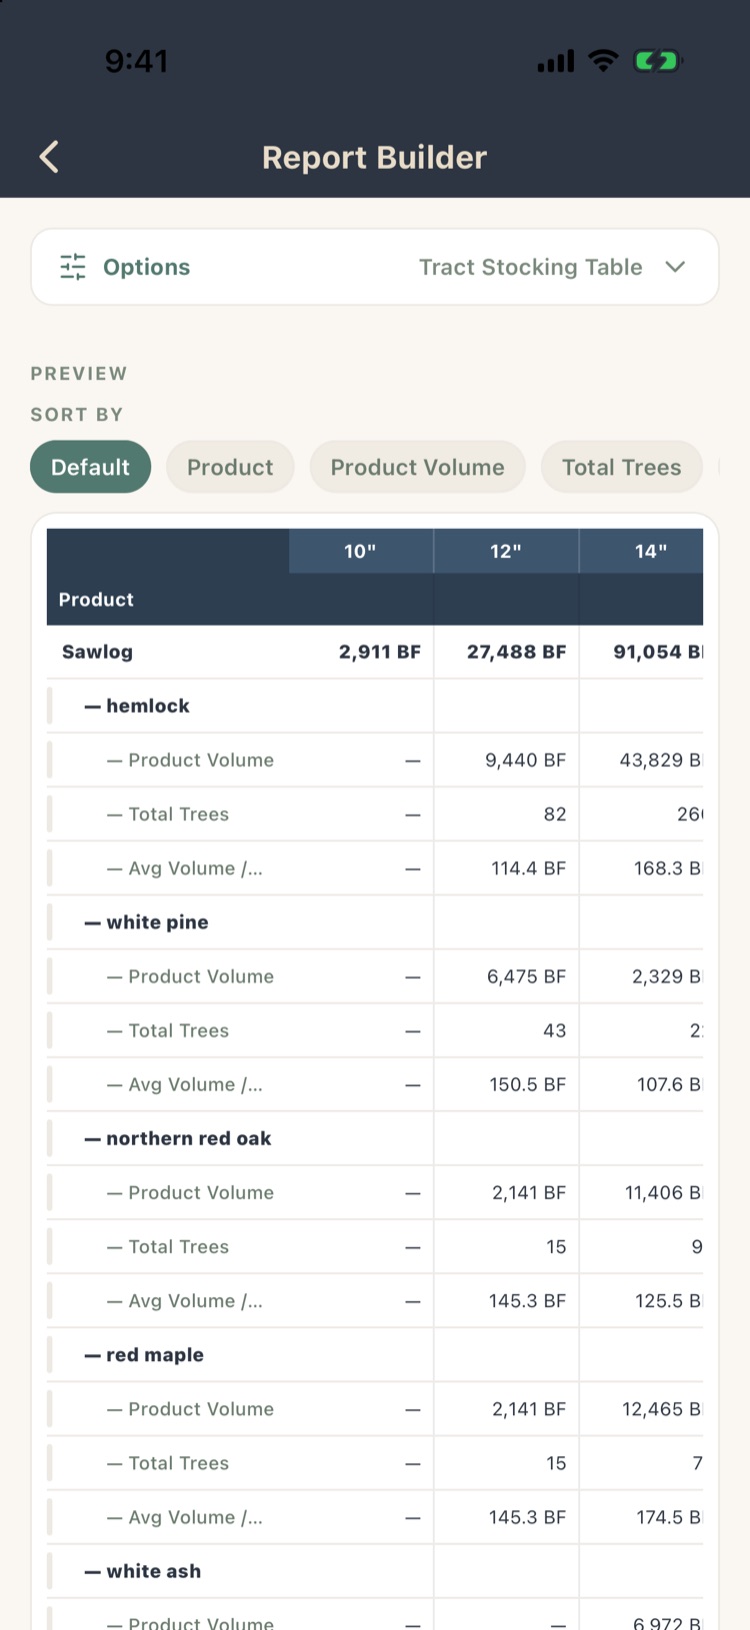
On a computer, the same builder at app.forestmetrix.com shows the whole table across the screen as you change options.
8.11FIA comparisons Pro
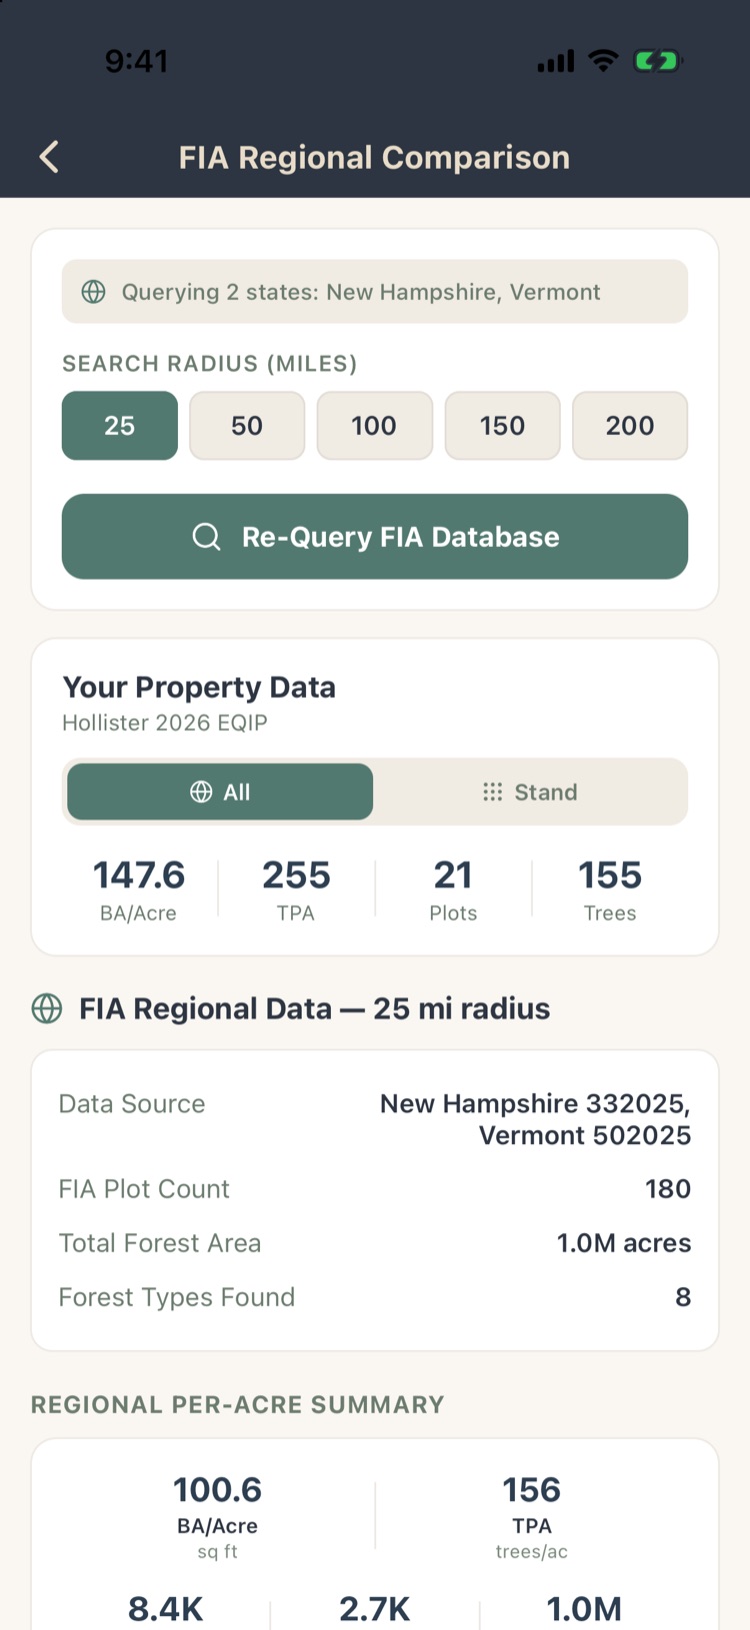
The USDA Forest Service’s Forest Inventory and Analysis (FIA) program measures plots across the country. Forest Metrix can compare your property with the FIA plots around it.
FIA Regional Comparison
- Choose a search radius: 25 to 200 miles. The app picks the states that fall inside it.
- Tap Query FIA Database. A connection is needed.
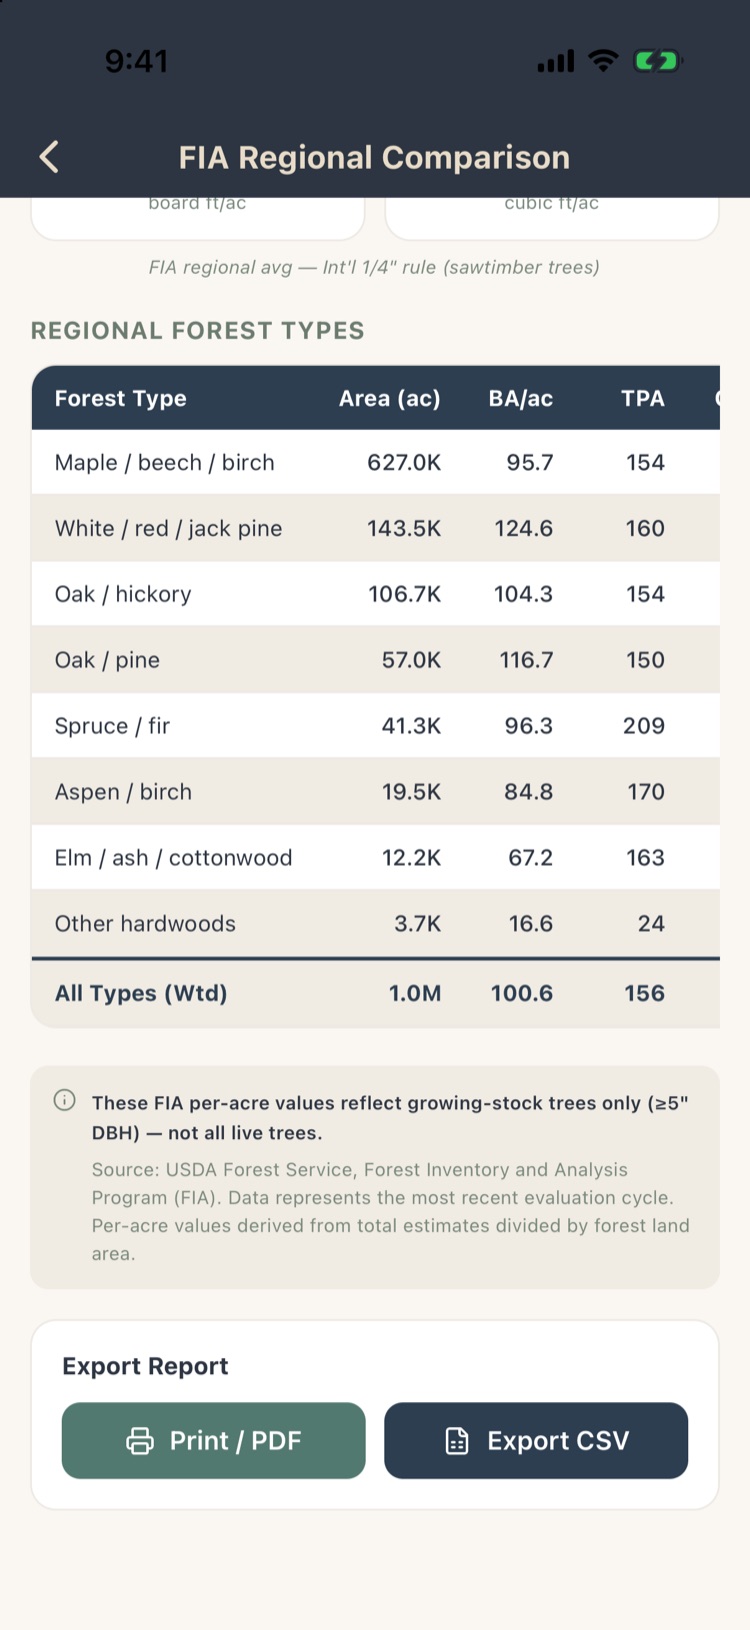
- Compare your property’s basal area, trees per acre and volume with the regional averages. Filter by forest type, and see the region’s forest types by area.
Export the comparison with Print / PDF or Export CSV. FIA figures cover growing-stock trees only (5" DBH and up), so expect them to differ from a cruise that includes smaller trees.
FIA Stand Analysis
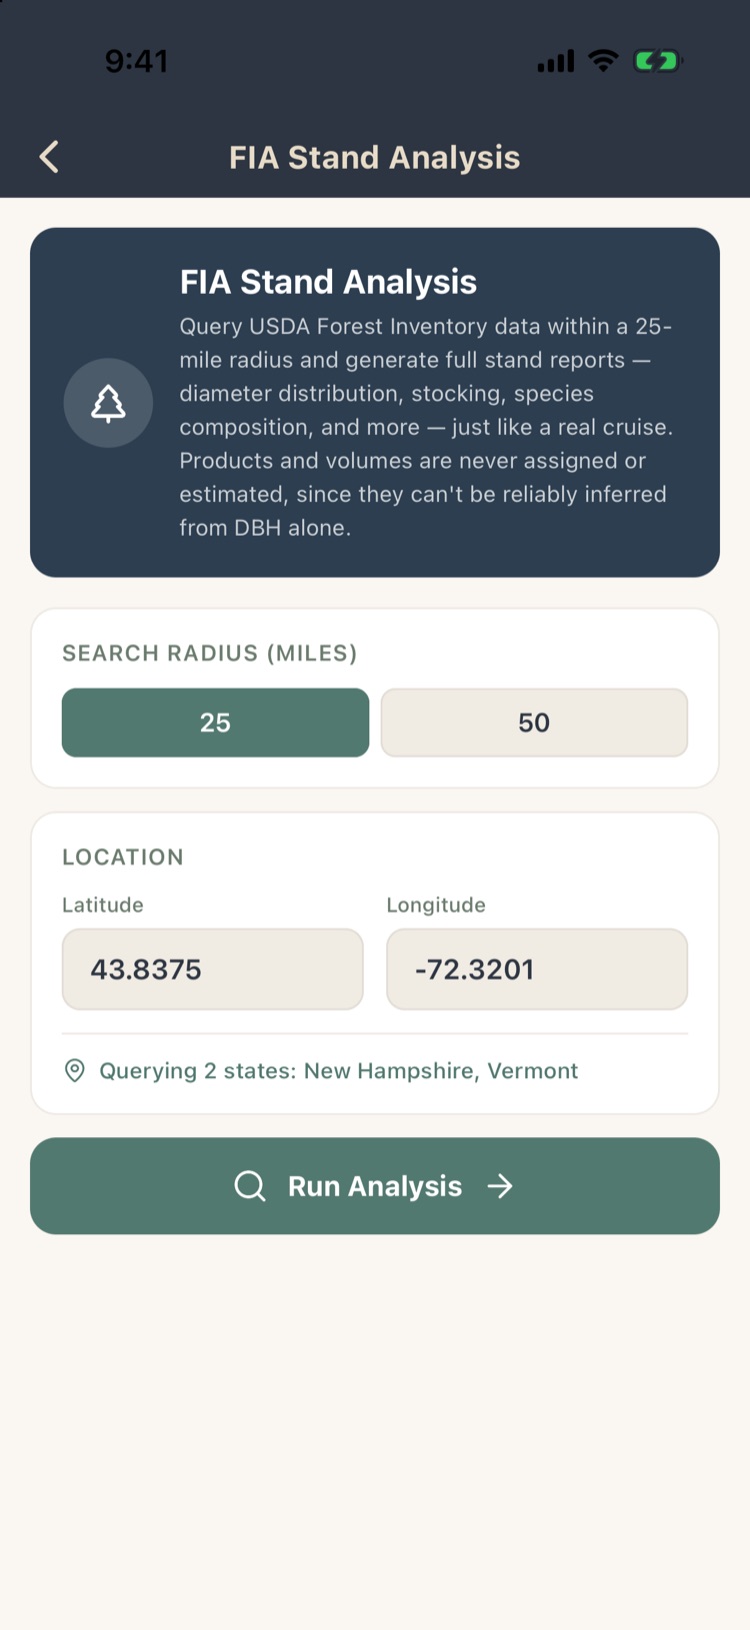
Builds a stand from FIA data for an area and lets you run the standard reports on it, for a property you haven’t cruised yet. Choose a 25- or 50-mile radius around the project’s location (or type a latitude and longitude) and tap Run Analysis. Diameter distribution, stocking and species composition come from the FIA trees; products and volumes are never assigned, since they can’t be inferred from DBH alone.
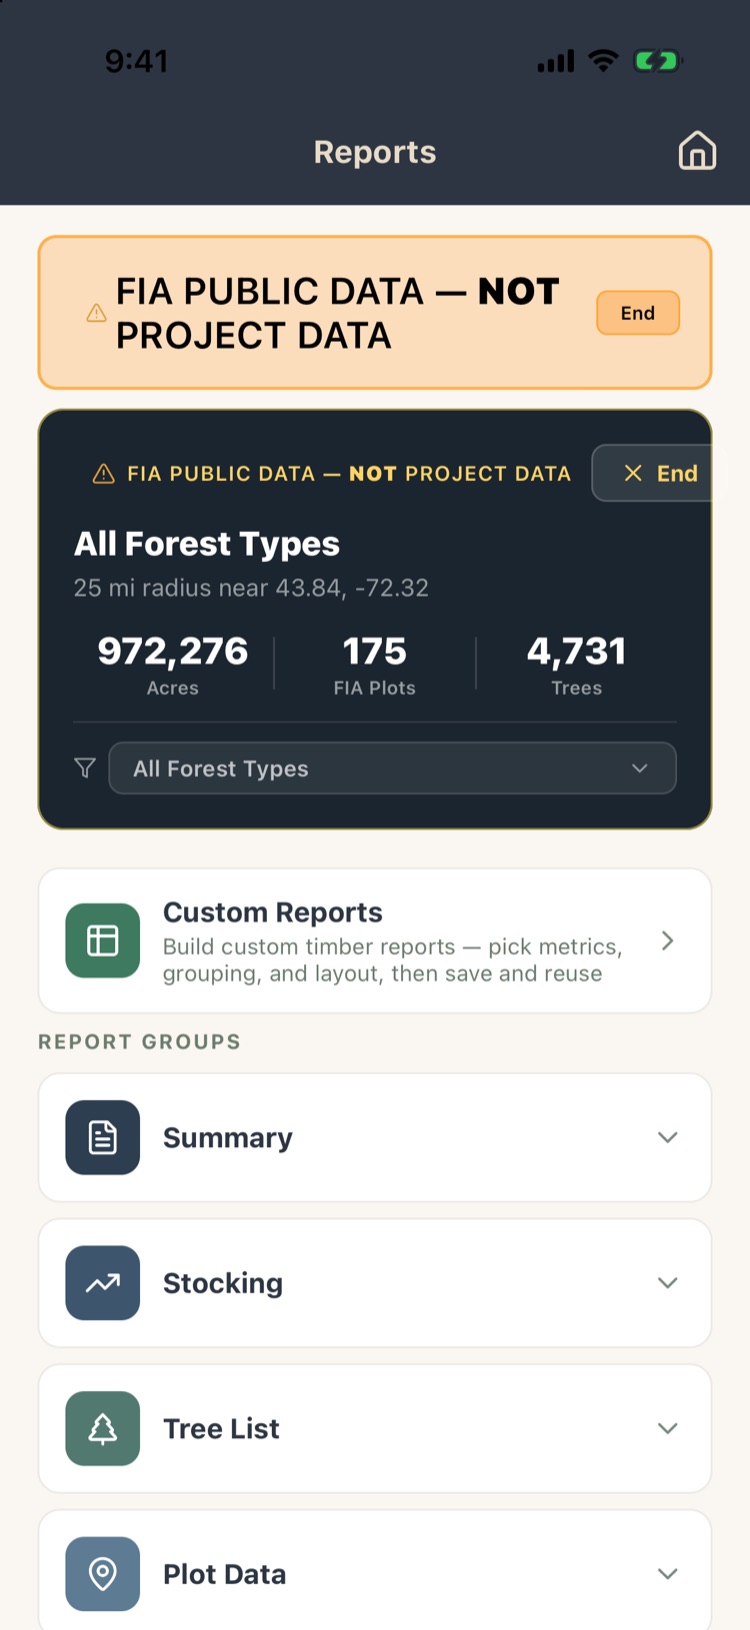
While it’s active, every report shows a banner saying the figures are FIA data, not project data, and the summary card shows the FIA acres, plots and trees, with a forest-type filter. Tap End to go back to your own data.
8.12Report settings
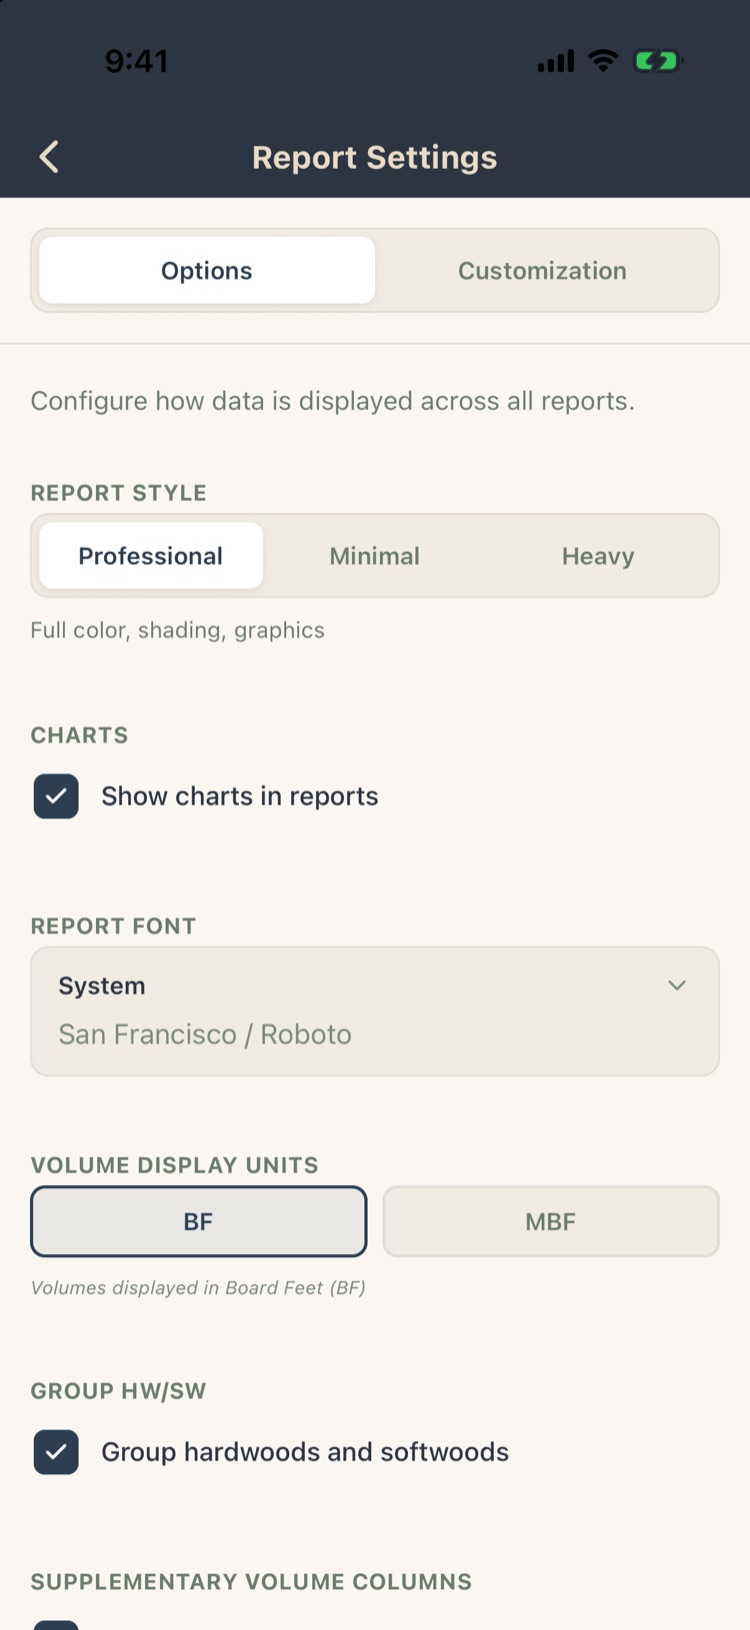
Report Settings (at the bottom of the Reports screen, or under Settings) has two tabs.
Options
- Report Style Pro: Professional (full color and shading), Minimal or Heavy.
- Charts Pro: show charts in printed reports.
- Report Font. Pro
- Volume Display Units: board feet or MBF.
- Group HW/SW: subtotal hardwoods and softwoods.
- Supplementary Volume Columns: add cubic feet or tons per acre.
- Enabled Products: which products appear in reports.
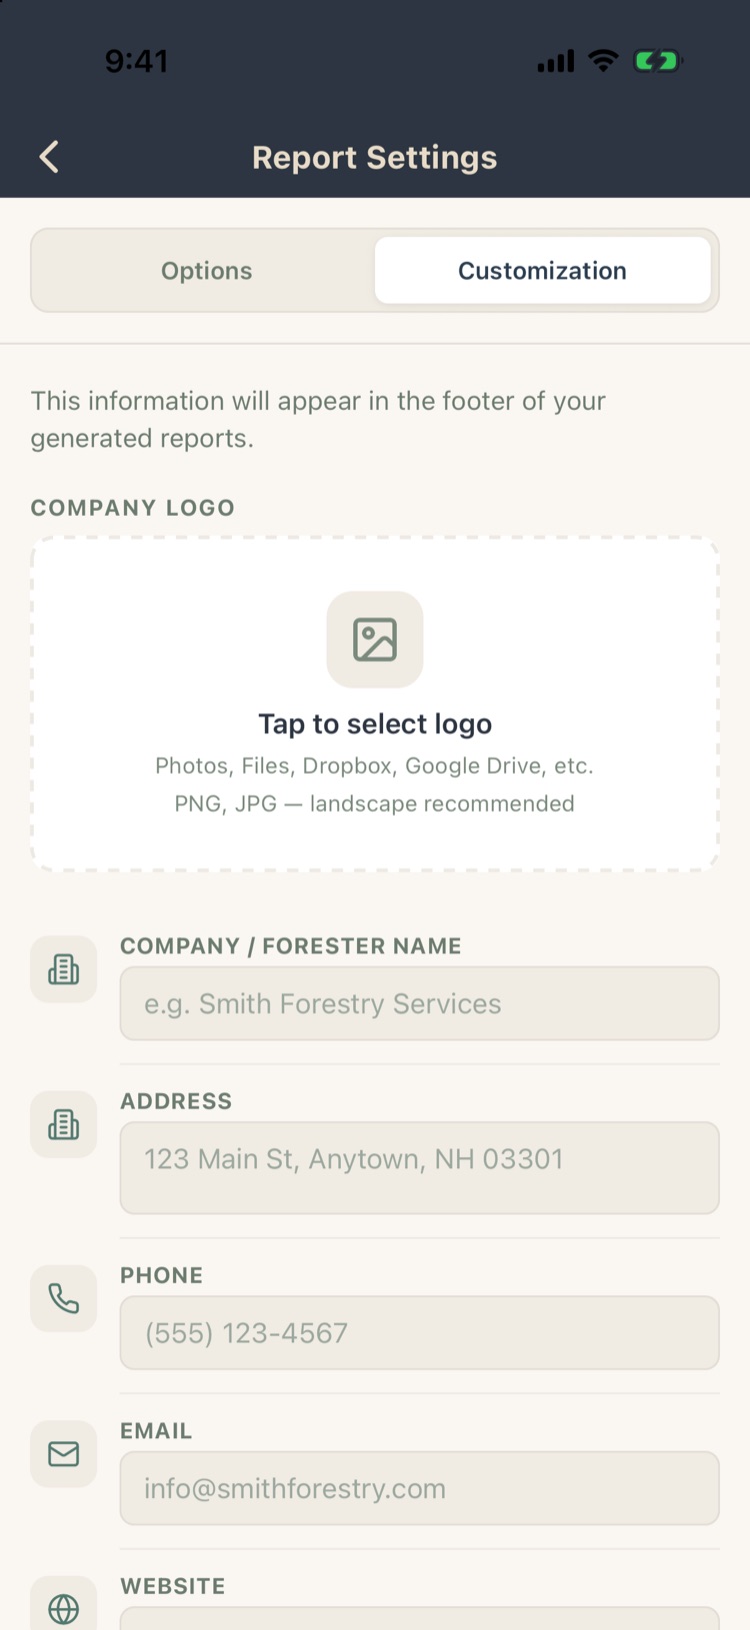
Customization
Your company logo, name, address, phone, email and website, printed in the footer of every report. A preview shows how it will look.
8.13How the numbers are worked out
- Which plots count. A plot counts when it has trees or is marked done. Empty plots that aren’t marked done are treated as not yet visited and left out, and plots that belong to no stand are left out; a banner says how many of those were left out.
- Expansion. On variable-radius plots each tree stands for BAF ÷ its basal area trees per acre; on fixed plots, 1 ÷ plot acres. Per-acre figures are averaged over the counted plots in each stand, then combined across stands by acreage (or equally, if you choose).
- 100% tally stands divide by the stand’s acres instead of averaging plots, and have no sampling error.
- Volume follows each product’s volume rule and the project’s taper model (Mesavage & Girard / Parker 1998 by default; Clark & Souter or Behre if you choose). Defect is deducted. Long calls are cut into logs no longer than Max Length Cut Log.
- Double sampling applies the measure plots’ volume per unit of basal area to the counted basal area.
The Tech Manual under Help & Support has more detail on each method (Chapter 14).